Outline of the Wholesale Price Index (WPI)
Contents
- 1. Purpose and uses
- 2. Composition
- 3. Coverage
- 4. Grouping
- 5. Base year and year for calculation of weights
- 6. Selection of commodities
- 7. Weights
- 8. Sample prices
- 9. Calculation of index
- 10. Publication of index
- 11. Linked index
- Appendix: Index for Fresh Foods
- Notes: Major changes in the 1995 base index
1. Purpose and uses
The Wholesale Price Index (WPI) focuses on the prices of goods traded among corporations. The main purpose of the index is to investigate price movements that vigorously reflect the demand and supply condition of individual goods, with the view to facilitating the analysis of both macro- and micro- economic conditions. The indexes of less-aggregated-levels also have a role as a "deflator" that transforms nominal output values into real quantities.
It follows from these characteristics of the index that gross transaction volumes of each good if available, would be the most suitable source for its weight calculation. Unfortunately, however, such statistics are not regularly available so that the WPI has relied instead upon regularly-published data such as manufacturer's shipments and custom clearance since the adaptation of weighted averages in 1933.
2. Composition
The WPI is composed of the Domestic Wholesale Price Index (DWPI), the Export Price Index (EPI), the Import Price Index (IPI), and the Overall Wholesale Price Index (OWPI). The first three indexes cover different types of products as indicated below, while the OWPI is a synthesis of these three indexes.
DWPI
The DWPI measures the price movement of domestically-produced and domestically-used goods with "sample prices" collected either from the producer or wholesaler of these goods.
The weights of the index are based on the value of producers' shipments for domestic demand, which are calculated by subtracting the value of exports (from Japan Exports & Imports published by the Ministry of Finance) from the value of total producers' shipments (from Census of Manufactures published by the Management and Coordination Agency) *.
- In the case of non-manufacturing products where the value of producers' shipments is not available from Census of Manufactures, other official statistics are used as substitutes.
EPI(IPI)
The EPI (IPI) measures the price movement of export (import) products on FOB (CIF) basis and compiled both in terms of yen and contracted currencies.
The weights are calculated from the value of exports (imports) from Japan Exports & Imports.
OWPI
The OWPI is the weighted average of the DWPI, EPI, and IPI.
3. Coverage
Conceptually, the WPI covers all type of commodities (except services) traded regularly among corporations. In practice, however, the following commodities are excluded;
(a) commodities of which the weights in the index are impossible to calculate (e.g. office buildings), (b) commodities of which the prices are difficult to survey continuously and of which the weights cannot or should not be imputed to other commodities selected in the index because of the absence of similarities, etc. (e.g. ships, arms, and ammunition), and (c) commodities of which the transaction volumes as well as prices show excessive seasonality sufficient to prevent the continuity of price surveys or the collection of representative "sample prices" (e.g. fresh foods) *.
- As the prices of exported ships and imported fresh foods are relatively easy to survey, their price indexes are calculated and published separately from the WPI.
The share of the commodities (b) and (c) above amounts to about one-tenth of the total calculable shipment values (including exports and imports). As a matter of practice, the remaining part of calculable shipment values is called the "transaction values for the index."
| DWPI | EPI | IPI | OWPI | |
|---|---|---|---|---|
| Total calculable shipment values of commodities (incl. exports and imports) (A) | (billions yen) 268,811.2 |
(billions yen) 41,530.9 |
(billions yen) 31,548.8 |
(billions yen) 341,890.9 |
| "Transaction values for the index" (B) | 254,214.2 | 38,266.4 | 28,149.6 | 320,630.2 |
| Non "transaction values for the index" (C) | 14,597.0 | 3,264.5 | 3,399.2 | 21,260.7 |
| B/A | 94.6% | 92.1% | 89.2% | 93.8% |
| C/A | 5.4% | 7.9% | 10.8% | 6.2% |
4. Grouping
The WPI has two grouping systems; the basic grouping, which classifies commodities selected for the index calculation by their attributes, and the special grouping, which classifies commodities selected in the basic grouping after rearranging for specific use.
(1) Basic grouping
The DWPI is classified into five classes: "Major group," "group," "subgroup," "commodity class," and "commodity." "Major group" and "group" are based on Japan Standard Industrial Classification published by the Management and Coordination Agency. The former has five categories and the latter has 21 (of which three categories are the same as those of "major group"). "Subgroup" and "commodity class" which are subordinate classes of "group", are categorized according to the respective attributes of commodities that make up these groups.
DWPI by major group and group
| Manufacturing industry products | Electrical machinery |
| Processed foodstuffs | Transportation equipment |
| Textile products | Precision instruments |
| Lumber & wood products | Other manufacturing industry products |
| Pulp, paper & related products | Agricultural, forestry & fishery products |
| Chemicals | Edible agricultural, livestock & fishery products |
| Plastic products | Inedible agricultural & forestry products |
| Petroleum & coal products | Mining products |
| Ceramic, stone & clay products | Electric power, gas & water |
| Iron & steel | Scrap & waste |
| Nonferrous metals | (Reference index) Foodstuffs Machinery & equipment |
| Metal products | |
| General machinery |
The EPI and the IPI are classified into four classes: "Group," "subgroup," "commodity class," and "commodity" (same as the DWPI, except for "major group"). Both indexes are composed of eight categories at the "group" level, which are determined according to the Trade Statistics (the "Basis Classification Index" for Summary Report Trade of Japan published by the Ministry of Finance).
| EPI by group | IPI by group |
|---|---|
| Textiles | Foodstuffs & feedstuff |
| Chemicals | Textiles |
| Metals & related products | Metals & related products |
| General machinery | Wood, lumber & related products |
| Electrical machinery | Petroleum, coal & natural gas |
| Transportation equipment | Chemicals |
| Precision instruments | Machinery & equipment |
| Other manufacturing industry products |
Other primary products & manufactured goods |
| (Reference index) Transportation equipment including ships |
(Reference index) Foodstuffs & feedstuff including fresh foods |
The basic grouping in the OWPI is similar to that of the DWPI, which is classified by "major group" (five categories) and "group" (21 categories). However, the subordinate class of "group" has different classifications; instead of "subgroups" and "commodity class," it has three categories, "Domestic products," "Exports," and "Imports."
(2) Special grouping (by stage of demand and use in the OWPI)
The special grouping is classified by demand stage and use in order to analyze how a price change in one stage is transmitted to other stages.
Commodities are divided into groups based on demand stage, which are subdivided into subgroups based on use.
Grouping by stage of demand
First, commodities are generally divided into "Domestic demand products" (domestic products for domestic demand and imports) and "Exports." According to Input-Output Tables published by the Management and Coordination Agency, the former is categorized as "Raw materials" (unprocessed materials), "Intermediate materials" (processed materials) which are used or consumed in production, and "Final goods" for final demand users.
Grouping by stage of use
"Domestic demand products" are subdivided into subgroups by use, which refers to the "Basis Classification of Goods" in Indices of Industrial Production published by the Ministry of International Trade and Industry. The categories of the "Exports" are the same as those used in the domestic market, as it is difficult to know how they are used overseas.
Commodities that are in several categories in both demand and use (e.g. eggs are used for ingredients of cakes as well as food as is) are classified, according to a ratio determined by weighting (when it is difficult to calculate the ratio for dividing weight due to data limits, the commodity is put into the principal category). The ratio for weighting of "Exports" corresponds to "Domestic demand products."
Concepts of Each Group by Stage of Demand and Use
| Group | Concept |
|---|---|
| Domestic demand products | Domestic products and imports. |
| Raw materials | Unprocessed materials produced by primary industries, and used or consumed in production. |
| Raw materials for processing | Raw Materials processed into goods, including scrap and waste. |
| Construction materials | Raw Materials directly used for construction, such as building and civil engineering. |
| Fuel | Raw Materials used as fuel in production (e.g. crude petroleum, natural gas). |
| Other raw materials | Raw materials other than above (e.g. city water, water for industry). |
| Intermediate materials | Processed materials that are used or consumed for further production, including expendable supplies. |
| Semi-finished goods | Intermediate Materials that still require further processing. |
| Construction materials | Intermediate Materials directly used for construction, such as building and civil engineering. |
| Fuel & energy | Intermediate Materials used as fuel and sources of energy in production. |
| Other intermediate materials | Intermediate Materials other than the above (e.g. expendable supplies, packaging materials, and containers used for business use). |
| Final goods | Finished goods ready for sale to final demand users. |
| Capital goods | Durable goods with a relatively high unit purchase price, which are used for production for a year or longer. |
| Consumer goods | Goods mainly used and consumed by households. |
| Durable consumer goods | Consumer goods with duration of a year or longer, and with a relatively high unit purchase price. |
| Non-durable consumer goods | Consumer goods with duration of less than a year, and with a relatively low unit purchase price. |
| Exports | |
| Semi-finished goods | Same as corresponding categories of "Intermediate materials" under "Domestic demand products" (except for a few commodities under "Other intermediate materials," the category of which is combined with "Semi-finished goods" for convenience' sake). |
| Construction materials | Same as corresponding categories of "Intermediate materials" under "Domestic demand products" (except for a few commodities under "Other intermediate materials," the category of which is combined with "Semi-finished goods" for convenience' sake). |
| Capital goods | Same as corresponding categories of "Final goods" under "Domestic demand products." |
| Consumer goods | Same as corresponding categories of "Final goods" under "Domestic demand products." |
| Durable consumer goods | Same as corresponding categories of "Final goods" under "Domestic demand products." |
| Non-durable consumer goods | Same as corresponding categories of "Final goods" under "Domestic demand products." |
(Reference indexes of "Domestic demand products")
Producer goods (raw materials + intermediate materials)
Construction materials (construction materials under raw materials and intermediate materials)
Fuel & energy (fuel under raw materials + fuel & energy under intermediate materials)
Materials (raw materials for processing + semi-finished goods)
Investment goods (capital goods + construction materials under raw materials and intermediate materials)
(Reference indexes of "Exports")
Producer goods (semi-finished goods + construction materials)
5. Base year and year for calculation of weights
The base year for the indexes and weight calculation is 1995.
6. Selection of commodities
(1) Selection criteria
As shown below, the commodities employed in the DWPI, the EPI, and the IPI are selected so as to secure enough coverage for their own "transaction values for the indexes." The commodities in the OWPI are the same as those in the other three indexes.
DWPI
Selected commodities are those with transaction values no less than 1/10,000 (25.4 billion yen) of the "transaction values for the indexes" (i.e. the total producers' shipment value of domestic products for the domestic market).
EPI
Selected commodities are those with transaction values no less than 5/10,000 (19.1 billion yen) of the "transaction values for the indexes" (i.e. the total export value).
IPI
Selected commodities are those with transaction values no less than 5/10,000 (14.1 billion yen) of the "transaction values for the indexes" (i.e. the total import value).
(2) Exceptional selection of commodities
Commodities are also selected in the case where they are likely to satisfy the above-mentioned criteria in the near future or considered to be essential in compiling the grouping. The selection is done in the following manner: (a) If the transaction value of the commodity is close to the selection criteria, the commodity is selected individually, and (b) if the total transaction value of a group of "similar commodities" reaches the selection criteria, the whole group is selected as one hypothetical commodity (e.g. medical gauze, bandages, absorbent cotton, and other medical supplies are selected as the commodity called "Medical supplies" in the DWPI).
On the other hand, commodities with volatile transaction values are deleted from the list of selected commodities even though their transaction values exceed the selection criteria. So are custom-made commodities of which the fixed-quality price is hard to measure and commodities for which prices are hard to obtain from different companies. As will be shown, the weights of "unselected commodities" are added to the weights of similar selected commodities in the process of weight calculation.
(3) Number of selected commodities
The number of selected commodities for the indexes with the base year 1995 is as follows:
| Number of commodities | |
|---|---|
| DWPI | 971 |
| EPI | 209 |
| IPI | 247 |
| OWPI | 1,427 |
7. Weights
(1) Calculation of weights
The weights of commodities for compiling the DWPI, the EPI, and the IPI are expressed as one-thousandths of the "transaction values for the indexes" down to the first decimal place.
The weights of commodities for the OWPI are expressed as one-thousandths of the total transaction value of the previous three indexes down to the second decimal place.
The weights of superordinate classes such as "group" used for compiling the basic grouping and special grouping are calculated by accumulating the weights of commodities.
The weights of each price index in the OWPI on 1995 base are as follows:
| Weights | |
|---|---|
| DWPI | 792.86 |
| EPI | 119.35 |
| IPI | 87.79 |
| OWPI | 1,000.00 |
(2) Unselected Commodities
The commodities which are a part of the "transaction values for the indexes," but are not selected in the indexes because of a lack of sufficient transaction values or because of a difficulty in having a continuous price survey, are called "unselected commodities." The weights of those "unselected commodities" are determined as follows:
- (a) If the attributes and price fluctuations of an unselected commodity resemble those of a selected commodity, the unselected commodity is classified as a "similar commodities." Its shipment (exports/imports) value is simply added to the corresponding selected commodity in the process of weight calculation.
- (b) Otherwise, the unselected commodity is classified as "other" and its shipment (exports/imports) value is added to those of the closest commodity class (subgroup, or group if deemed appropriate). In this case, the weight of individual commodities in the "commodity class", "subgroup" or "group" is increased in proportion to their shares. This procedure is called "imputation."
Contents of transaction values of commodities
| <-----------Unselected commodities----------- > | ||
| "Selected commodities" | (a)"Similar commodities" | (b)"Others" (imputed commodities) |
| <------------------------The transaction values of commodities----------------------------- > | ||
| The transaction values of commodities (A) (billions yen) | The values of selected commodities (B) (billions yen) | Coverage (B/A) (%) |
The values of "selected commodities"+ "similar commodities" (C) (billions yen) |
Coverage (C/A) (%) |
|
|---|---|---|---|---|---|
| DWPI | 254,214.2 | 192,724.4 | 75.8 | 199,986.3 | 78.7 |
| EPI | 38,266.4 | 22,419.3 | 58.6 | 27,787.4 | 72.6 |
| IPI | 28,149.6 | 21,071.2 | 74.9 | 22,695.4 | 80.6 |
| OWPI | 320,630.2 | 236,212.9 | 73.7 | 250,469.1 | 78.1 |
The transaction values of "commodity class," "subgroup," "group," and "major group" are calculated by accumulating the transaction values of commodities mentioned above. In each price index, the transaction values of "all commodities" are the "transaction values for the indexes." The transaction values of OWPI are the total transaction values of the previous three indexes.
(3) Weights of "sample prices"
In principle, the weights of the "sample prices" (see 8.) that comprise the same commodity are equally allocated. However, different weights are assigned in the case where their price fluctuations are obviously different due to differences in sales channels *, uses, or sources of import, and the data for weight allocation are available.
- For instance, different weights are assigned to the "sample price" of some commodities in the group of "Iron & steel" where there are two distinctive sales channels; tied sales channels for big users and regular sales channels for small users
8. Sample prices
(1) Basic principles of the price survey
The WPI is compiled from "sample prices" surveyed monthly by mail. In conducting the survey, foremost consideration is given to the following points:
- (a) The "sample price" should be chosen to reflect as closely as possible the demand and supply condition of commodity in concern.
- (b) The movement of a "sample price" needs to be as genuine as possible in that it is free from changes in the commodity's quality or the conditions of contract.
(2) Surveyed stage in distribution process
In the case of price surveys for the DWPI, one stage in distribution process is chosen for each commodity where transactions are most active and prices move vigorously to reflect changes in demand and supply conditions. To be more specific, the Bank of Japan (BOJ) employs the following rules in the selection of surveyed stages:
- (a) The selling prices of primary wholesalers are chosen if primary wholesalers play a critical role in matching demand and supply for the commodity using their own inventories as a buffer.
- (b) The selling prices of producers are chosen if the commodity is sold directly to retailers or to final users. This is also the case if wholesalers act as intermediaries but have little influence on price formation.
- (c) In the case where prices of wholesalers and producers seem to equally reflect the demand and supply conditions, the former is usually chosen.
In the EPI, the surveyed price stage is FOB at the Japan port of exportation. In the IPI, it is CIF at the Japan port of importation.
(3) Surveyed point of time
In principle, the surveyed point of time is the time of contract. If the prices cannot be surveyed at the time of contract, they are surveyed at the time of shipment or arrival.
(4) Design of "sample prices"
In designing "sample prices," representative products are specified for each commodity. Both correspondent companies and the conditions of contracts are fixed and effective transaction prices (in principle, adjusted for discounts, rebates, etc.) are surveyed. If the "sample prices" cannot be defined as above, they are flexibly fixed to fit reality.
(5) Price survey method
At the beginning of every month, correspondent companies are requested to send back the previous month's survey that records the representative prices of domestic, exported, and imported products in ten-day periods (usually average prices. See 9. (3) for ten-day price index). As the prices of exports and imports are expressed in contracted currencies, (a) contracted currency prices are converted into yen in compiling indexes in yen terms using the ten-day average of spot exchange rates (foreign currency buying rates for exports and selling rates for imports) prevailing in every corresponding survey period quoted by banks to customers, and (b) contracted currency prices are used for indexing in contracted currency terms (the weights of selected commodities are the same as those for the index in yen terms).
If there is no transaction in a certain survey period then it is treated as no change (no fluctuation) *.
- In the case of exports and imports, conversion into yen is also suspended so that the "sample price" in yen terms remains unchanged as well.
(6) Number of correspondent companies and "sample prices"
The number of "sample prices" in WPI is 4,082, or around three "sample prices" per commodity. The number of correspondent companies is 2,211, which is smaller than that of "sample prices" because some correspondent companies are asked to report the "sample prices" for two or more commodities
| Commodities(A) | "Sample prices" (B) | B/A | Correspondent Companies | |
|---|---|---|---|---|
| DWPI | 971 | 3,367 | 3.47 | 1,340 |
| EPI | 209 | 606 | 2.90 | 386 |
| IPI | 247 | 835 | 3.38 | 485 |
| OWPI | 1,427 | 4,808 | 3.37 | 2,211 |
In the DWPI, the "sample prices" in the Tokyo area are mainly surveyed. If they are thought to be unrepresentative of the price movements of each selected commodity, such as in "Machinery & equipment," "Textile products," "Electric power, gas & water," and "Lumber & wood products," supplementary "sample prices" are surveyed outside of the Tokyo area (the number of "sample prices" from outside Tokyo amounts to about 740).
(7) Replacement of "sample prices" and quality adjustments
If a product in the "sample prices" ceases to be representative of a selected commodity, or the contract terms change, or the surveyed companies are required to change, "sample prices" are replaced without delay. When replacing "sample prices," any price difference between the new and old products will be adjusted as below so that only the price change, and not the price change attributed to quality change, will be reflected in the indexes.
- (a) The new "sample price" will be linked with the old one without adjustment (direct comparison), as long as the difference in quality between the two products is negligible.
- (b) The new "sample price" will be linked so as not to raise or lower the index (treated as no change), if the price difference between the two products is entirely attributed to quality.
- (c) The new "sample price" will be linked so as to reflect the price change unrelated to any quality change if the price difference between the two products exceeds that associated with a change in quality. The index will rise or fall.
However, if it is difficult to compare the difference in quality between the two products, the price is treated unchanged.
The production cost method (which specifies the price difference corresponding to the quality difference on the assumption that the cost for the quality change equals the price difference due to its quality difference) is mainly used to specify the part of the price difference that corresponds to the quality change out of the price difference between the new and old products. From 1990 base index, the hedonic regression method * is incorporated to complement estimates of the quality of products such as computers, which undergo technological innovation so rapid that the cost corresponding to the quality difference is very difficult to estimate by the production cost method.
- The hedonic regression method is a technique for estimating price changes corresponding to the change of various characteristics in a product objectively and quantitatively. This assumes that a part of the price difference between products is caused by the quality difference, which are estimated from a change in various characteristics (such as MIPS, storage capacity, etc., of mainframe computers).
9. Calculation of index
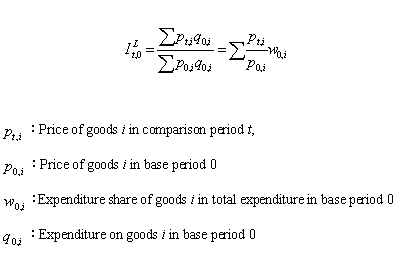
(1) Index formula
The index formula is the Laspeyres formula (relative method), which is the weighted arithmetic mean based on the fixed value-based weights for the base period.
Laspeyres formula (relative method)
(2) Calculation method
Monthly price indexes are compiled from monthly "sample prices" which are the simple arithmetic mean of three ten-day "sample prices" in the month. Details of the calculation are as follows (Indexes are accurate to the first decimal place): First, each "sample price" is converted into an index form. Second, commodity by commodity, these "sample price" indexes are multiplied by their own weights and then aggregated to give a weighted commodity index, which in turn is divided by the commodity's weights to yield a "commodity" level price index. This process is iterated to give higher-aggregated-level price indexes such as "commodity class," "subgroup," "group," "major group," and "all commodities."
The annual average index in terms of calendar and fiscal year is obtained from the simple arithmetic mean of monthly indexes.
(3) Ten-day price index
Separate from the monthly survey, "sample prices" with relatively large intra-month fluctuations (e.g. those in Iron & steel, Chemicals, and Nonferrous metals etc.) are selected and surveyed every ten days by phone. Utilizing this data and the assumption that other non-surveyed "sample prices" remain unchanged, a "Ten-day price index" is compiled and released. Currency conversion rates for the EPI and the IPI are renewed each time this is done. Users of the ten-day price index are advised to pay special attention to the index's provisional character as the changes in non-surveyed "sample prices" are not known until the across-the-board monthly survey is conducted and when a "sample price" is replaced, "sample prices" are usually revised retrospectively up to the beginning of the month.
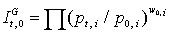
(4) Wholesale Price Index using geometric mean formula
The Laspeyres formula, on which the WPI is based, tends to overstate inflation, due to the fact that the fixed weight it uses ignores shifts in demand from relatively expensive goods toward inexpensive goods unless the index is rebased (upward formula bias problem).
To alleviate this weakness, the BOJ is separately compiling the "WPI using geometric mean formula (WPI-UGM)." The WPI-UGM is calculated on the assumption that at the low-aggregated-level such as "sample price," "commodity" and "commodity class," the state of "perfect substitution" holds; that is, expenditure shares do not change with relative price changes. The WPI-UGM is currently published as a reference index.
Geometric Mean Formula
For further details, readers are encouraged to look at "Release of a Reference Wholesale Price Index Using a Geometric Mean Formula," the Bank of Japan, Quarterly Bulletin, August 1998.
10. Publication of index
The WPI is released according to the following schedule:
Ten-day index
At the end of the following ten-day period.
Monthly index
At the middle of the following month. Details are in Price Indexes Monthly issued by the Bank of Japan, Research and Statistics Department around the middle of the following month.
The exact release dates are announced in Releases by the Bank of Japan (updated every Friday) which can be found on the BOJ Internet Web site. The Public Information Division, Public Relations Department, will answer inquiries about index figures.
11. Linked index
The linked index is calculated for making continuous index so that a long-term index series is available: (a) In the 1995 Base Linked Index, the index series of past figures is converted into new (1995 base) index and retroactive. (b) In the Prewar Base OWPI, the index on the 1995 base is converted into the prewar base index and connects with the index series of past figures.
(1) 1995 Base Linked Index
The 1995 Base Linked Index is available from January 1960 as to the index series for "group" and superordinate classes of "group" in the basic grouping and the corresponding classes in the special grouping.
The linked index is calculated by using the linked coefficient computed for each index series from new (1995 base) and old (1990 base) indexes of 1995 on monthly basis (the annual average indexes in terms of the calendar and fiscal year are obtained from the simple arithmetic mean of monthly indexes). The calculation for the linked index on 1995 base is as follows:
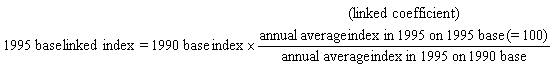
For the link calculation of index, the classification in each previous base index is rearranged into the basic grouping or special grouping that are used for the 1995 base index (the selected commodities and weights remain to be used for the previous base index).
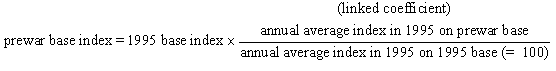
(2) Prewar Base OWPI
The Prewar Base OWPI (base period: 1934-36 average = 1, compiled since October 1900) from January 1995 is compiled by the rearranged 1995 base index classification of basic grouping and special grouping for the prewar base index classification (which consists of 12 categories at the class of "group" in the basic grouping and five categories in the special grouping by use) and connected with prewar base index of December 1994.
The prewar base index is calculated by using the linked coefficient of prewar base index to 1995 base index of 1995 on monthly basis (the annual average indexes in terms of the calendar and fiscal year are obtained from the simple arithmetic mean of monthly indexes). The calculation for the prewar base index is as follows:
Appendix: Index for Fresh Foods
The Index for Fresh Foods is compiled only for an annual average in terms of the calendar and fiscal year. Fresh foods are excluded from the WPI because it is difficult to survey prices continuously since both (a) prices or shipment values fluctuate widely according to season or harvest, and (b) prices vary from area to area.
The index is compiled for fresh foods individually, and is separated from the WPI. "All commodities including fresh foods" and "Foodstuffs including fresh foods" are compiled as reference indexes in the OWPI.
(1) Coverage
Covers vegetables, fruit, fish and shellfish that are raw and frozen. Domestic products and imports are included.
(2) Grouping
Composed of three groups; "Vegetables," "Fruit," and "Fish & shellfish"
(3) Base year and year for weight calculation
The base year for the indexes and weight calculation is 1995. However, the weights for commodities in each group ("Vegetables," "Fruit," and "Fish & shellfish") are calculated by averaging two years; the base year and the previous year (1994 and 1995).
(4) Selection of commodities
In principle, selected commodities are those with transaction values no less than 1/10,000 (32.1 billion yen) of transaction values for the OWPI.
The total number of selected commodities is 77 (29 for "Vegetables," 19 for "Fruit," and 29 for "Fish & shellfish").
(5) Weights
The weights of commodities are expressed as one-thousandths of the "transaction values for the indexes" of the base year (1995) down to the first decimal place.
However, the weights for each commodity are calculated by the average of the "transaction values for the indexes" in the base year and the previous base year.
Specifically, they are calculated by the transaction values of the group multiplied by the ratio of each commodity to the corresponding group on the two-year average transaction values (Vegetables: 302.5, Fruit: 216.8, Fish & shellfish: 480.7).
The weights of fresh foods (the weights corresponding to "All commodities" in the OWPI which are set at 1,000.0) are 21.7 and is used for the index calculation of "All commodities including fresh foods" and "Foodstuffs including fresh foods" in the OWPI.
As data sources, Statistics on Production and Shipment of Vegetables, Statistics on Production and Shipment of Fruits and Nuts, and Statistics on Fisheries and Water Culture Production published by the Ministry of Agriculture, Forestry and Fisheries, and Japan Exports & Imports published by the Ministry of Finance are used.
(6) Sample prices
In principle, the "sample prices" are annual (in terms of fiscal and calendar year) average unit prices (shipment values / shipment volumes) of commodities at the Tokyo Central Wholesale Market.
(7) Calculation of index
The index formula is the Laspeyres formula (relative method), which is the weighted arithmetic mean based on the fixed value-based weights for the base period.
Calculation of indexes for each "group" and "all commodities" is based on the accumulated figures of commodity indexes calculated by annual (in terms of calendar and fiscal year) average prices.
(8) Publication of index
Annual (in terms of calendar and fiscal year) index is compiled and published in Price Indexes Monthly of March and June.
(9) 1995 Base Linked Index
For index series of "group" and superordinate class of "group," the linked index is retroactive to 1960 for the calendar year annual average index and to 1965 for the fiscal year. (Both indexes are retroactive from the beginning of the index series).
Notes: Major changes in the 1995 base index
The base year for the indexes and weight calculation has been updated from 1990 to 1995. In addition, the selected commodities have been expanded to enhance the accuracy of indexes, and the grouping have also been revised.
1. Grouping
(1) Abolition of the "Index for Special Grouping by Industry" in the EPI and the IPI.
The publication of the "Index for Special Grouping by Industry" in the EPI and the IPI has been discontinued in Price Indexes Monthly and Price Indexes Annual since the previous (1990 base) index revision, owing to the decline in needs for analyses. The index was abolished in this 1995 base index revision, because there had not been so many requests as for its publication and the continuation of index compilation.
(2) Change in the name of group
The former group of "Metals" in the IPI has been changed to "Metals & related products" corresponding to the expansion of selected commodities (added metal products as newly selected commodities).
2. Selection of commodities
In the EPI and the IPI, the selected commodities have been reviewed and expanded to reflect the structural changes in exports and imports in recent years. In the IPI, in particular, the commodities of textile products and household electrical equipment are focused on expansion.