Addition of Sample Enterprises to the Tankan
February 18, 2009
Bank of Japan
Research and Statistics Department
The Bank of Japan has decided that, from the March 2009 Tankan (Short-Term Economic Survey of Enterprises in Japan), 112 enterprises will be added to samples of the survey, and the total number of sample enterprises will be 10,649, including 208 financial institutions.
We examine the statistical accuracy of the Tankan once a year, to prevent a decline in the statistical accuracy due to a decrease in the number of sample enterprises caused by bankruptcies, mergers, and other factors. We add new sample enterprises to the Tankan when the examination reveals that statistical accuracy has declined (see "Sample Design and Sample Maintenance of TANKAN," June 7, 2004, for details).
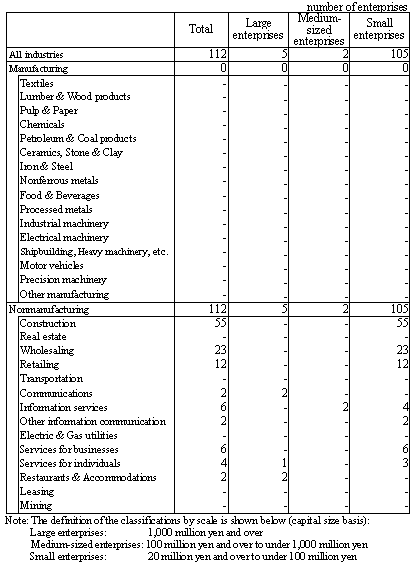
We decided to add 112 enterprises to the Tankan (see the Appendix) after the recent examination of the statistical accuracy of the latest Tankan (December 2008). As a result, the total number of the sample enterprises for the March 2009 Tankan will be 10,649 (including 208 financial institutions).
Details of the examination are as follows.
1. Sample Distribution
Population enterprises are classified into 383 strata by industry, scale based on capital size, and number of regular employees to calculate the population estimate.
For each stratum subject to the sample design,1 we examined whether the distribution of the sample enterprises properly reflected that of the population enterprises.
The result revealed that there was no stratum in which the distribution of the sample had deviated from that of the population.2 However, there were some strata for which the sample distribution indicated a high likelihood of deviating from the distribution of the population with a further decline in the number of sample enterprises.
To maintain statistical accuracy, sample enterprises have been added to these strata.
- Strata with less than five enterprises (46 strata) have been excluded.
- The "test of the goodness of fit" using chi-square distribution is used in the regular examination. This method tests the null hypothesis, H0: "The distribution of the sample and that of the population have the same shape." When the hypothesis is statistically rejected, it is judged that a deviation exists between the distribution of the sample enterprises and that of the population enterprises.
2. Error Ratios of the Population Estimates
For all of the six main divisions by industry and scale (manufacturing/nonmanufacturing and large/medium-sized/small, see below), the error ratios of the population estimates3(measured by sales data) after the addition of 112 samples remained within the target range (3 percent for manufacturing and 5 percent for nonmanufacturing).
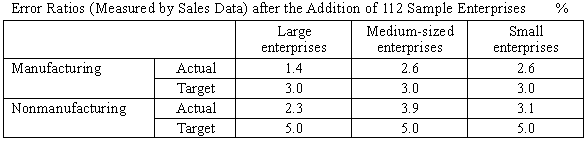
- 3Population estimates based on sample surveys, such as those in the Tankan, inevitably entail certain estimation errors, and this should be taken into consideration when the data are used.
For further information, contact:
Business Survey Research and Statistics Department Bank of Japan
Email:post.rsd5@boj.or.jp
(Appendix)