Determinants of the Natural Rate of Interest in Japan -- Approaches based on a DSGE model and OG model --
Nao Sudo, Yosuke Okazaki, Yasutaka Takizuka (Bank of Japan)
Research LAB No.18-E-1, June 13, 2018
Keywords: Natural rate of interest; DSGE model; OG model
JEL Classification: E20, E32, E43, E44, E52, J11
Contact: nao.sudou@boj.or.jp (Nao Sudo)
Summary
Since it is not directly observable, the natural rate can only be inferred from various estimates based on different methodologies. We discuss the developments and determinants of the natural rate, and the impact of the demographic landscape on its outlook, using estimates derived from structural models by Okazaki and Sudo (2018) [PDF 909KB], and Sudo and Takizuka (2018) [PDF 1,066KB]. Different estimates computed by these structural models, together with other models, suggest that it is likely that the natural rate in Japan has declined continuously since the 1990s, and has currently been around 0%.
According to the structural models, the decline has been brought about mostly by changes in neutral technology, but the functioning of financial intermediation has also had an important effect, indicating that these factors will remain crucial to future developments as well. While population aging is predicted to depress the natural rate, it is not likely to depress the rate drastically.
Introduction
The natural rate is the real interest rate at which economic activity and prices neither accelerate nor decelerate, and is regarded as a benchmark rate when assessing whether the monetary policy stance is accommodative or not. Theoretically, therefore, it is important to estimate the natural rate and determine if the real interest rate is higher or lower than the estimates. Not surprisingly, remarks on the natural rate are often found in speeches by central bankers in major economies (Carney [2016], Constancio [2016], Yellen [2016]). Because the natural rate is not observable and there is no consensus regarding how it should be estimated, it is necessary, when determining the rate, to study the common features that appear in various estimates of the natural rate computed using different methodologies, and not to rely solely on one particular estimate. It should also be noted that different estimation methodologies are often equally justifiable, and all estimates come with reservations.
The Bank of Japan has estimated the natural rate in Japan, using several methodologies, in its "Comprehensive Assessment" (Bank of Japan [2016] and Fujiwara et al. [2016]). Estimates of the natural rate based on the structural models we describe here, the Dynamic Stochastic General Equilibrium Model (hereafter DSGE model) and the Overlapping Generations Model (hereafter OG model), could serve to address the underlying drivers of the natural rate, and may be regarded as supplements to these estimates already used. In fact, some central bank economists have increasingly used structural models in studying the natural rate (Del Negro et al. [2017], Gagnon et al. [2016], Gerali and Neri [2017], and Goldby et al. [2015]). Structural models provide theoretical predictions about the economic decisions made by households and firms that determine the natural rate. They show how these decisions are influenced by changes in economic structure, such as in neutral technology, demographic landscape, and the functioning of financial intermediation, and how this in turn leads to changes in the natural rate. Using this class of model allows us, for example, to identify the drivers of the natural rate, and to assess the impact on the natural rate of future changes in the economic structure. 1
- One concern about estimates derived from structural models, when compared with those derived from the approaches used in the "Comprehensive Assessment," is that they may be affected by the theoretical assumptions made in the model.
Determinants of the natural rate based on the DSGE model
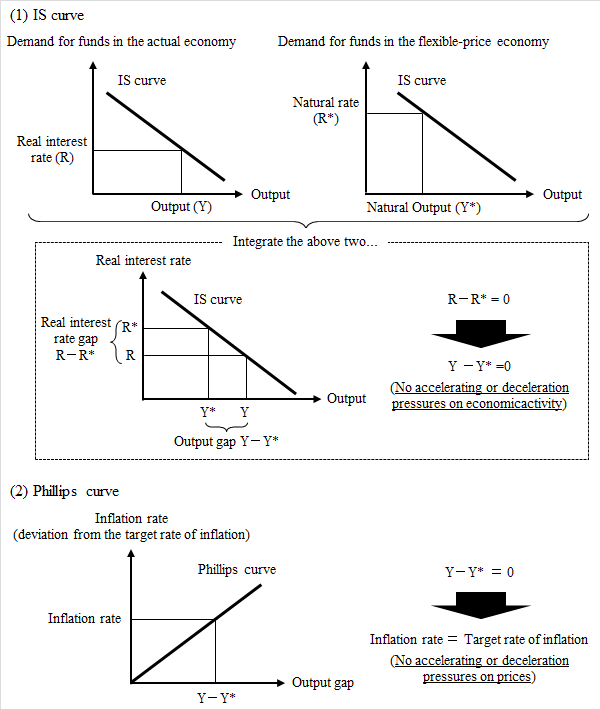
A New Keynesian DSGE model is a macroeconomic model that has been widely used among central bankers and academics. In this framework, the actual output deviates from the natural output due to frictions associated with nominal rigidities, and the natural rate is defined as the real interest rate that prevails under a hypothetical economy in which such frictions are absent and the output coincides with the natural output.2 As shown in Figure 1, given a negative relationship between the real interest rate gap and the output gap expressed in the IS curve, and a positive relationship between the output gap and the inflation rate expressed in the Phillips curve, the output gap is zero when the natural rate is equal to the real interest rate, which in turn implies that the inflation rate is equal to its target rate. In this sense, the natural rate is the real interest at which economic activity and prices neither accelerate nor decelerate, as stated at the beginning of this article.
Figure 1: The natural rate in New Keynesian models
The natural rate is given at the intersection of the demand and supply curves in the funds market, as is the actual real interest rate, but in the hypothetical economy in which all prices are flexible. Okazaki and Sudo (2018) choose five factors that have been considered essential drivers of these curves in existing studies, including Rachel and Smith (2015) and Summers (2014), and assess their quantitative importance by estimating a DSGE model that incorporates these factors using Japan's data. The five factors are: (i) neutral technology, (ii) functioning of financial intermediation, (iii) demographic factors,3 (iv) investment-specific technology, and (v) demand factors. Each factor may shift the demand or supply curve, thereby affecting the natural rate, as illustrated in Figure 2. For Japan, the Solow residual, the proxy of neutral technology, has exhibited a slowdown since the 1990s, as Figure 3 (1) shows, suggesting the possibility that a fall in the return on capital due to the slowdown in neutral technology has discouraged firms' investment demands and depressed the natural rate. In addition, around the period of the banking crisis starting in the mid-1990s, credit volume plummeted because of the damaged balance sheets of firms and banks (Figure 3 (2)), indicating that malfunctions in financial intermediation may have also depressed the natural rate by reducing these agents' demand for funds.
Figure 2: Flows of funds in the model of Okazaki and Sudo (2018)
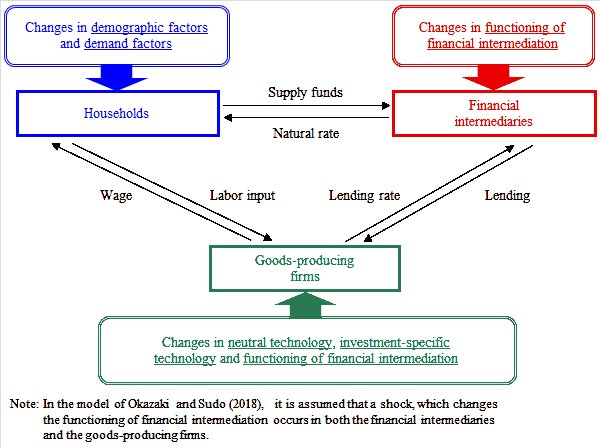
Figure 3: Neutral technology and total credit to GDP ratio
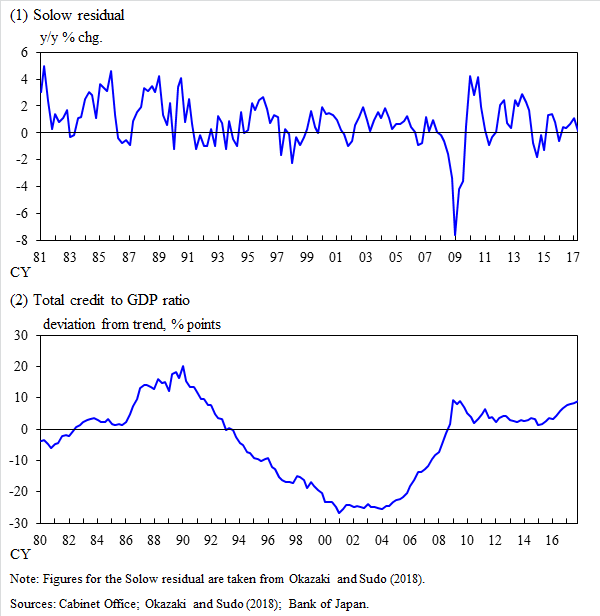
Figure 4 shows the estimated time path of the natural rate in the DSGE model, together with estimates derived from the approaches used in the "Comprehensive Assessment." All the estimates agree on a secular decline since the 1990s, to a level ranging from around 0% to 1% in the 2000s and beyond, but there is less agreement on the precise estimates for recent years. Estimates using the DSGE model and Laubach and Williams (2003) have been approaching the potential growth rate that is now in the range of 0.5-1.0%, while those based on Imakubo et al. (2015) and the HP filter have hovered around slightly below zero or have further declined modestly, suggesting overall that the current level of the natural rate is likely to be around 0%.
Figure 4: Natural rate based on various methodologies
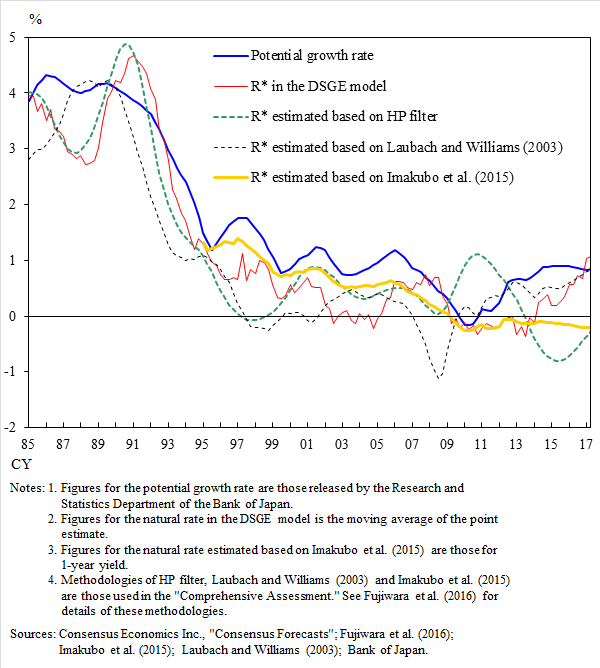
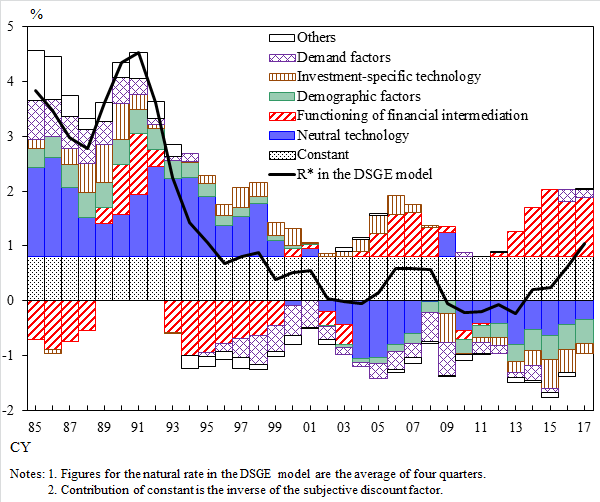
Figure 5 shows the historical decomposition of the natural rate into the contribution of each driver. The quantitatively largest driver that has shaped the secular decline has been neutral technology. For example, more than half of the 4% point decline in the natural rate from the 1980s to recent years, has been attributed to changes in neutral technology. The functioning of financial intermediation has been the second largest driver, affecting the natural rate rather cyclically. For example, during the banking crisis from the mid-1990s to the early 2000s, it depressed the natural rate by 1% point, while it has raised the natural rate recently. The contributions of the other three factors have been relatively small.
Figure 5: Historical decomposition of the natural rate based on the DSGE model
- 2More precisely, the "flexible-price economy" corresponds to an economy where nominal rigidities and shocks to the Phillips curve are absent. For details, see Woodford (2003).
- 3Okazaki and Sudo (2018) study the effects of shocks to working-age population growth exclusively, and do not study the overall effect of the demographic landscape. Sudo and Takizuka (2018) study the effect of the demographic landscape from a broader perspective.
Impact of demographic factors on the natural rate based on the OG model
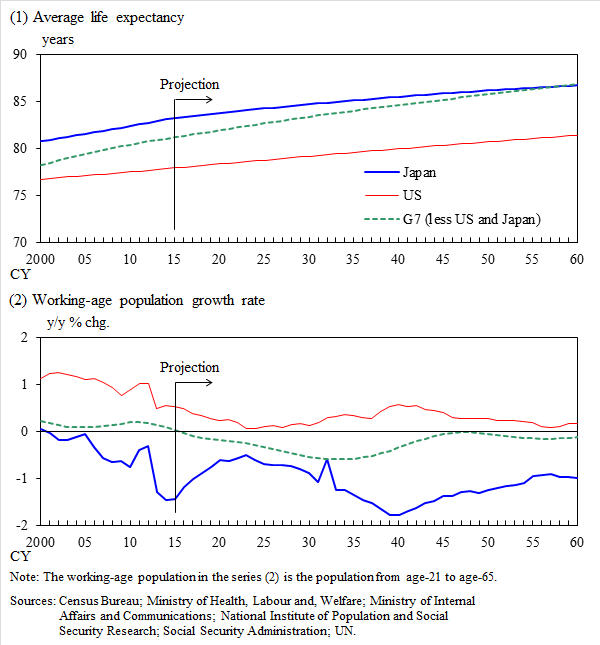
While the natural rate in years ahead is likely to vary with the aforementioned drivers, such as neutral technology and the functioning of financial intermediation, the prospects for most of these drivers are uncertain from today's perspective. Demographic landscape may be the exception. As shown in Figure 6, Japan is expected to experience continuing population aging that is more pronounced than in other advanced countries. We therefore discuss the impact of population aging in the years ahead, based on an OG model.
Figure 6: Population aging in major countries
OG models address a life-cycle of households' economic decisions, and are used in analyses on the relationship between demographics and macroeconomic variables, including those of the social security system. The OG model of Sudo and Takizuka (2018) incorporates 80 generations of households, the social security system, and the government, all of which are precisely calibrated to Japan's economy, so that the model can serve to quantify in detail the transmission of demographic changes to the natural rate. Such a large quantitative model is needed to determine the net impact because population aging can in theory affect the natural rate in either direction, as shown in Figure 7.
Figure 7: Theoretical predictions about the effects of population aging on the natural rate
| Factors | Effects on the funds market | Effects on the natural rate |
|---|---|---|
| 1. Decline in labor inputs | A relatively excess amount of capital stock reduces demand for capital |  |
| 2. Withdrawing savings by retired households | An increase in the number of dissaving households causes a reduction in capital supply. |  |
| 3. Precautionary saving for a longer life caused by increased longevity | Increased longevity encourages households to save more for their longer life and increases capital supply. | |
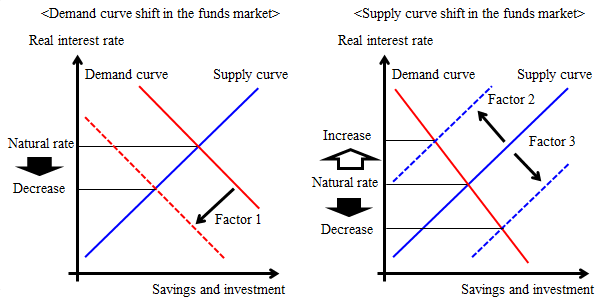
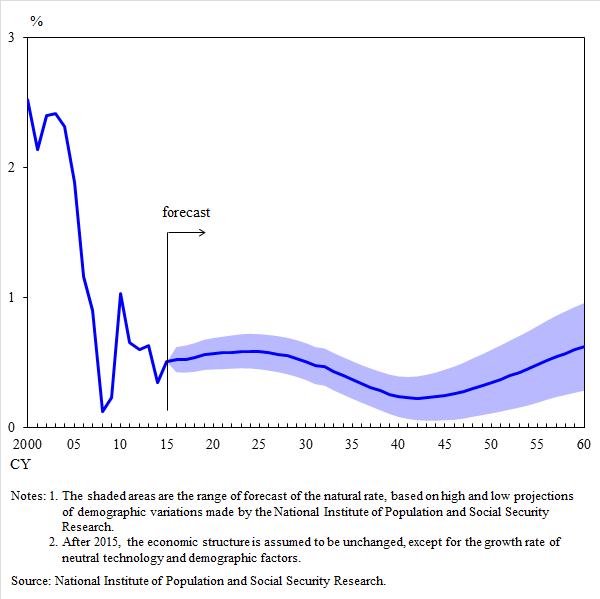
Figure 8 shows the projection of the natural rate to 2060 based on the model, using population forecasts calculated by the National Institute of Population and Social Security Research (IPSS).4 Here, neutral technology and other economic structures are unchanged from latest conditions in 2016 onwards. The natural rate declines gradually until the 2040s, though it never falls below 0% and its level does not deviate much from the current level.
Figure 8: Simulated outlook for the natural rate based on the OG model
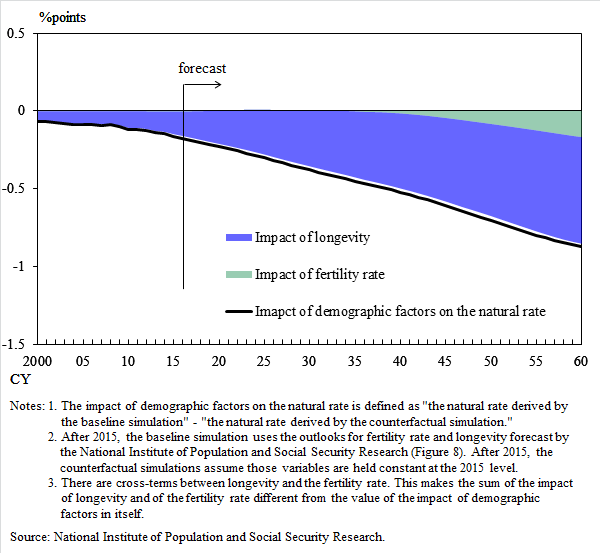
In order to isolate the effects of population aging on the natural rate, Figure 9 shows the deviation of the two natural rates: the natural rate computed under the assumption that demographic variables will evolve in line with the forecasts of the IPSS, which we refer to as the "baseline simulation," and the alternative natural rate computed under the assumption that the fertility rate and life expectancy will be arrested in 2015, which we refer to as the "counterfactual simulation."5 Based on the figure, demographic factors depress the natural rate, and the key transmission channel is changes in longevity. As households face increased longevity, they have an added incentive to save so as to insure against a longer life after retirement. Consequently, aggregate capital stock is accumulated while labor inputs fall, exerting downward pressure on the natural rate.
Figure 9: Impact of demographic factors on the natural rate
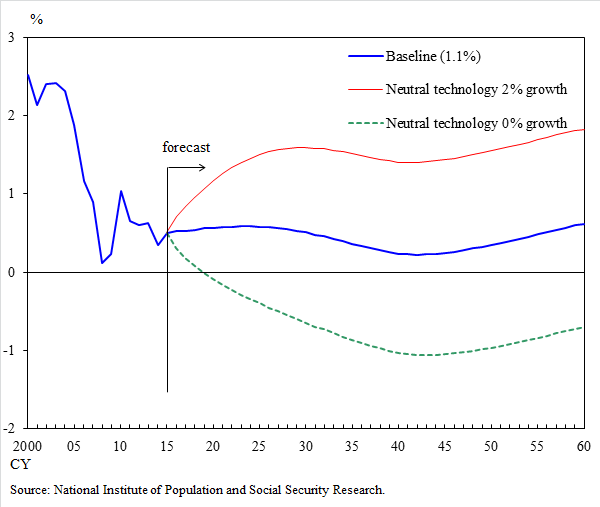
Admittedly, prospects for the natural rate also depend on other economic structures. Figure 10 shows two alternative projections of natural rates that are computed under the assumption that neutral technology grows at 2% and 0%, respectively, from 2016 onwards, and the projection of the natural rate shown in Figure 9 where technology is assumed to grow at 1.1%. Neutral technology importantly affects the natural rate. The natural rate reaches about 2% when neutral technology grows at 2%, while it drops below zero when technology grows at 0%.
Figure 10: Simulations under alternative assumptions on neutral technology
- 4Sudo and Takizuka (2018) extract the long-run dynamics of macroeconomic variables over 100 years by abstracting from short-term shocks and nominal price stickiness. In this article, we refer to the real interest rate in their model as the natural rate, since the former rate is considered to track the dynamics of the natural rate in the New Keynesian model.
- 5The household sector in Sudo and Takizuka (2018) consists of households from age-21 to age-100 population, and the fertility rate in their model corresponds to the growth rate of age-21 population in the actual data.
Conclusion
In this article, we have provided an overview of the developments, determinants and prospects for the natural rate based on the studies of Okazaki and Sudo (2018), and Sudo and Takizuka (2018), which examine the natural rate in Japan using structural models.
Based on the different estimates obtained from these structural models and other models, it is likely that the natural rate has shown a secular decline since the 1990s, and has recently been around 0%. These structural models suggest that a large part of the variations in the rate can be attributed to changes in neutral technology. In some periods, however, including the period of the banking crisis and recent years, the functioning of financial intermediation has also had an important effect on variations in the natural rate.
The natural rate is expected to remain susceptible to changes in economic structure, such as those in neutral technology or the functioning of financial intermediation. Population aging is expected to advance further in coming years, and these demographic changes will exert downward pressure on the natural rate, though such pressure is not likely to reduce the natural rate drastically.
References
- Bank of Japan (2016) "Comprehensive Assessment: Developments in Economic Activity and Prices as well as Policy Effects since the Introduction of Quantitative and Qualitative Monetary Easing (QQE) The Background. [PDF 814KB]"
- Carney, M. (2016) "Uncertainty, the Economy and Policy, [PDF 568KB] (Link to an external website)" speech at the Court Room, Bank of England, June 30, 2016.
- Constancio, V. (2016) "The Challenge of Low Real Interest Rates for Monetary Policy, (Link to an external website)" lecture at Macroeconomics Symposium, Utrecht School of Economics, June 15, 2016.
- Del Negro, M., D. Giannone, M. P. Giannoni, A. Tambalotti (2017) "Safety, Liquidity, and the Natural Rate of Interest, [PDF 5,082KB] (Link to an external website)" Federal Reserve Bank of New York, Staff Report, No. 812.
- Fujiwara, S., Y. Iwasaki, I. Muto, K. Nishizaki, N. Sudo (2016) "Developments in the Natural Rate of Interest in Japan, [PDF 369KB]" Bank of Japan Review Series, No. 2016-E-12.
- Gagnon, E., B. K. Johannsen, D. Lopez-Salido (2016) "Understanding the New Normal: The Role of Demographics, [PDF 987KB] (Link to an external website)" Board of Governors of the Federal Reserve System, Finance and Economics Discussion Series 2016-080.
- Gerali. A., S. Neri (2017) "Natural Rates across the Atlantic, [PDF 1,135KB] (Link to an external website)" Bank of Italy, Temi di discussione (Economic working papers) 1140.
- Goldby, M., L. Laureys, K. Reinold (2015) "An Estimate of the UK's Natural Rate of Interest, (Link to an external website)" Bank of England, Bank Underground, August 11, 2015.
- Imakubo, K., H. Kojima, J. Nakajima (2015) "The Natural Yield Curve: Its Concept and Measurement, [PDF 521KB]" Bank of Japan Working Paper Series, No.15-E-5.
- Laubach, T., J. C. Williams (2003) "Measuring the Natural Rate of Interest," Review of Economics and Statistics, 85, 1063--1070.
- Okazaki, Y., N. Sudo (2018) "Natural Rate of Interest in Japan -- Measuring Its Size and Identifying Drivers Based on a DSGE Model --, [PDF 909KB]" Bank of Japan Working Paper Series, No.18-E-6.
- Rachel, L., T. Smith (2015) "Secular Drivers of the Global Real Interest Rate, [PDF 1,828KB] (Link to an external website)" Bank of England Working Paper, No. 571.
- Sudo, N., Y. Takizuka (2018) "Population Aging and the Real Interest Rate in the Last and Next 50 Years -- A Tale Told by an Overlapping Generations Model --, [PDF 1,066KB]" Bank of Japan Working Paper Series, No.18-E-1.
- Summers, L. H. (2014) "U.S. Economic Prospects: Secular Stagnation, Hysteresis, and the Zero Lower Bound," Business Economics, 49, 65--73.
- Woodford, M. (2003) "Interest and Prices: Foundations of a Theory of Monetary Policy," Princeton University Press.
- Yellen, J. (2016) "The Federal Reserve's Monetary Policy Toolkit: Past, Present, and Future, [PDF 272KB] (Link to an external website)" remark at "Designing Resilient Monetary Policy Frameworks for the Future," a symposium sponsored by the Federal Reserve Bank of Kansas City, August 26, 2016.
Notice
The views expressed herein are those of the authors and do not necessarily reflect those of the Bank of Japan.