Central Bank Communication and the Management of Market Confidence: Two Episodes in 2013 in the U.S. and Japan
Koichiro Kamada (Bank of Japan)
Research LAB No.14-E-1, December 1, 2014
Keywords:
Central bank, communication, market confidence, bond market, volatility
JEL Classification:
D40, D83, E58, G12
Contact: kouichirou.kamada@boj.or.jp (K. Kamada)
Abstract
Confidence has a strong influence on security prices and volatility, but has received little attention in mainstream macroeconomics. Kamada and Miura (2014) [PDF 2,208KB] have recently revived this concept in their double-layered model of private and public information and shown how herding behavior emerges in sovereign bond markets. This article looks at two episodes that occurred in 2013 in the U.S. and Japan and uses their model to explain how the interest rate hikes and subsequent increase in volatility emerged. The analysis indicates that central bank communication is a promising policy tool to manage market confidence, but at the same time, could create unintended market turbulence.
Introduction
In his General Theory, Keynes wrote, "The state of long-term expectation…does not solely depend…on the most probable forecast we can make. It also depends on the confidence with which we make this forecast…" (Keynes, 1936, p. 148). That said, he continued, "The state of confidence…is a matter to which practical men always pay the closest and most anxious attention. But economists have not analysed it carefully and have been content…to discuss it in general terms." (ibid, pp. 148-149). Recently, the concept has gained much greater weight in the real financial market due to the progress of financial globalization and advances in information technology. After the recent global financial crisis and particularly the sovereign debt crisis in Europe, it is difficult for market analysts to write reports without using the expressions "risk-on" and "risk-off", which are modern expressions for market confidence. Yet, the attitude of economists has changed little. Mainstream macroeconomics has "developed", abstracting psychological factors. In fact, economists discuss the effectiveness of central bank forward guidance and asset purchase, but the concept of market confidence is missing in their analyses. This article revives the concept in the analysis of current monetary policy issues, especially central bank communication.
The state of confidence and security prices
The conceptual importance of market investors' confidence, or mass psychology, was illustrated persuasively by Keynes (1936) in the metaphor of beauty contests. In relation to this, Nirei and Watanabe (2014) recently developed a formal model of herding and showed analytically that the return on stocks follows a fat-tailed distribution rather than a normal distribution, even though the latter is frequently assumed in standard financial models. In their model, herding stems from rational behavior by investors who seek information aggressively. They distinguish two types of information available in the market, public or private: public information is open to everyone, while private information is accessible only to limited parties. However, each investor knows that other investors' private information, though not directly observable, can be inferred from the development of stock prices. Therefore, it is rational for investors to make investment decisions based on stock prices. Herding occurs, as investors buy stocks when prices are high and sell them when prices are low.
Recently, Kamada and Miura (2014) showed that herding occurs not just in stock markets but also in bond markets, especially sovereign bond markets, in their double-layered model of private and public information. As mentioned above, the existence of private information is a necessary condition for herding to occur. Let us consider a central bank that has just announced large policy changes. Suppose that these changes are so large that investors are uncertain as to the implications of these changes for long-term interest rates. Then it is quite natural for investors to begin to collect related information and draw scenarios for future interest rates by themselves. As long as investors do not publicize them, their scenarios are private information, even if all the ingredients are public information. Given this situation, rational investors pay close attention to the development of interest rates to figure out the unspoken expectations of other investors. In doing so, investors are caught in herding behavior with or without any intention.
Another and more important result obtained by Kamada and Miura (2014) is that the volatility of interest rates is limited by the value of public information, denoted by "q". In their model, this parameter is introduced as the probability that public information indicates the true state. Borrowing the expressions of Keynes (1921), the parameter measures both the "degree of certainty" of public information and the "relevance" to interest rates. That is, no matter how precise, public information is useless if it has nothing to do with interest rates; no matter how relevant to interest rates, public information is useless if it is completely wrong. On the contrary, if public information is valuable, or q is large, then investors' confidence grows rapidly. Interest rates rise when the confidence that announcements imply high long-term interest rates strengthens; they fall when the opposite confidence strengthens. Moreover, as confidence grows, whether interest rates are expected to rise or fall, the volatility of interest rates decreases. This gives us one potential explanation as to why interest rate volatility shrank particularly in the early 2000s under the Great Moderation.
Kamada and Miura (2014) also argue that central bank announcements are one of the most influential public information and thus that the value of public information reflects the central bank's preference toward the level and volatility of interest rates. However, the value of public information is not completely under the central bank's control. First, a vast amount of other public information is available to investors; the central bank's information is only part of it. Second, a policy announcement, when complicated, could be interpreted wrongly by investors. Furthermore, it is worth noting that the value of information is affected by psychological factors, and thus could jump suddenly without warning. Such misinterpretation of information and jumps in information value are likely when the central bank starts to change policy dramatically. The following two episodes that occurred in 2013 in the U.S. and Japan provide typical examples of central bank miscommunication which triggered interest rate hikes.
The Fed's tapering talk beginning in May 2013
Kamada and Miura (2014) showed that the value of public information, q, regulates the speed at which investors update their confidence, and thus is reflected in the amount by which long-term interest rates change. This suggests that we can use the data on long-term interest rates to infer the value of q indirectly. Figure 1 shows the estimation result obtained based on the monthly average of 10-year T note yields in 2013. The value of q is defined to be greater than or equal to 0.5. When equal to 0.5, it implies that public information includes no additional message. The dark-blue bars indicate that the released public information implies high interest rates; the light-blue bars indicate that the information implies low interest rates. In the estimation, we allow the value of q to change twice in the year and estimate those breaking points optimally. Once the estimate of q is obtained, it is used to infer the limit of the volatility of long-term interest rates.
Figure 1. Estimated value of q in the US
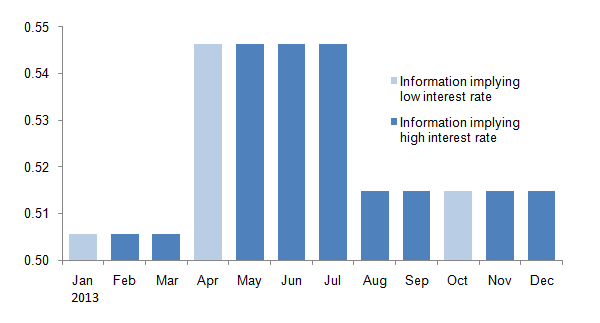
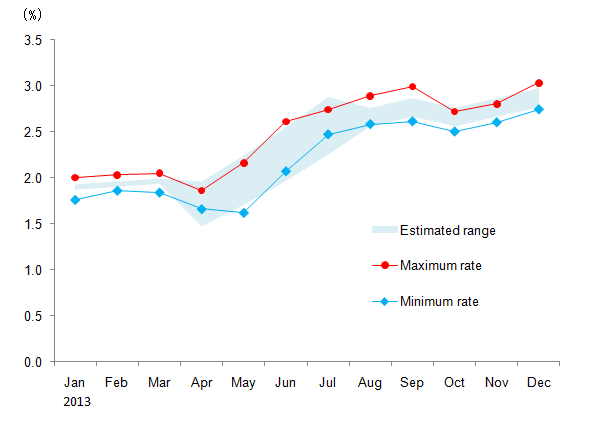
As shown in the figure, the estimate of q was almost 0.5 in the first quarter in 2013, and then it jumped up suddenly in the second quarter. Recall that the then-Federal Reserve Chairman Ben S. Bernanke made statements concerning the tapering of asset purchases in May and June of that year (Bernanke, 2013a, b). The statements were wrongly received by investors as a signal that quantitative easing was going to end soon. This had a great impact on the market and pushed up bond yields quite effectively. In Figure 2, the shaded area is the range implied by the estimated q within which long-term interest rates can move (see Kamada and Miura, 2014, for its construction). This range was extremely narrow in the first quarter of 2013, then expanded in the second quarter, and narrowed again thereafter. For reference, we put the monthly high and low in the same figure, marked by a red circle and a blue diamond, respectively. They show the actual range within which long-term interest rates moved. It is remarkable that the model-implied range is very close to this actual range.
Figure 2. Estimated and actual ranges of interest rate movements in the US
The Bank of Japan's introduction of quantitative and qualitative monetary easing in April 2013
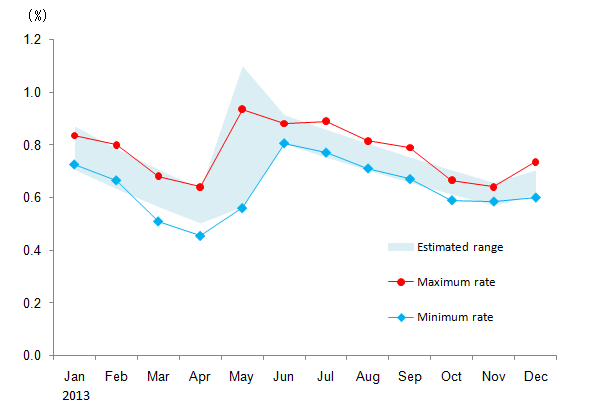
A similar estimation is conducted for Japan, based on the monthly average of 10-year yields on Japanese government bonds. As shown in Figure 3, the estimate of q jumped up in May 2013. As observed in Figure 4, the model-implied range expanded correspondingly, which coincided with the expansion of the actual range very closely, as observed in the study of U.S. T notes yields above. Two things were responsible for this jump of q. The first was the Fed's tapering talk beginning in May 2013 mentioned above. The rise in U.S. long-term interest rates exerted upward pressure on Japanese long-term interest rates. The second was the Bank of Japan's introduction of quantitative and qualitative monetary easing in April 2013 (Bank of Japan, 2013). The policy aimed to achieve the target inflation rate of 2 percent in around 2 years. The policy was somewhat confusing, however, in the following sense. According to the Fisher equation, high inflation implies high nominal interest, other things being equal. Following this logic, the majority of investors might interpret the announcement as a signal that the Bank would allow long-term interest rates to rise. It took time for investors to learn the Bank's intention, i.e., to keep interest rates low, or hopefully to lower them further, through massive asset purchases and monetary base provision, which were to squeeze the term premium as well as or more than to raise inflation expectations.
Figure 3. Estimated value of q in Japan
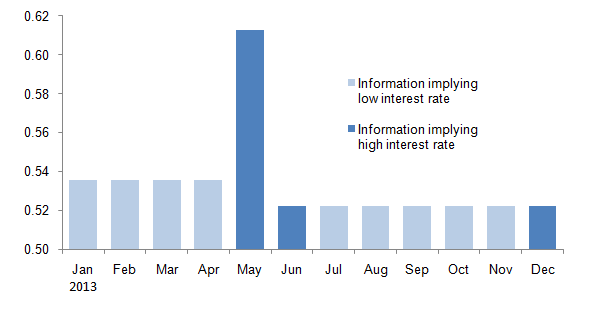
Figure 4. Estimated and actual ranges of interest rate movements in Japan
Policy implications
With the policy rate close to zero percent, central banks in advanced countries put high priority on communication strategy, in particular forward guidance, as a policy tool to manage market confidence and thereby affect long-term interest rates. In this relation, the discussion above has a useful policy implication for the communication strategy of central banks. That is, central bank announcements could be interpreted wrongly by market participants, however carefully the central bank chooses its language. A risk of miscommunication arises particularly when the central bank changes or is about to change its policy stance substantially. As Keynes (1939) emphasized in his critique on Tinbergen's econometric method, there is no mechanical one-to-one correspondence between policy measures and their effects. The same policy action or announcement could have different effects on the direction and amount of interest rate movements, depending on the state of confidence.
References
- Bank of Japan (2013), "Introduction of the 'Quantitative and Qualitative Monetary Easing' [PDF 154KB]," April 4, 2013.
- Bernanke, Ben S. (2013a), Statement by Ben S. Bernanke, Chairman of the Board of Governors of the Federal Reserve System before the Joint Economic Committee [PDF 104KB], May 22, 2013 (Link to an external website).
- (2013b), Transcript of Chairman Bernanke's Press Conference [PDF 130KB], June 19, 2013 (Link to an external website).
- Kamada, Koichiro, and Ko Miura (2014), "Confidence Erosion and Herding Behavior in Bond Markets: An Essay on Central Bank Communication Strategy [PDF 2,208KB]," Bank of Japan Working Paper Series, No. 14-E-6.
- Keynes, John M. (1921), A Treatise on Probability, London: Macmillan and Co.
- (1936), The General Theory of Employment, Interest and Money, London: Macmillan.
- (1939), "Official Papers," Economic Journal, Vol. 49, No. 195, pp. 558-577.
- Nirei, Makoto, and Tsutomu Watanabe (2014), "Beauty Contests and Fat Tails in Financial Markets." (Link to an external website)
Notice
The views expressed herein are those of the author alone and do not necessarily reflect those of the Bank of Japan.