The natural yield curve: its concept and developments in Japan
Kei Imakubo, Haruki Kojima, Jouchi Nakajima (Bank of Japan)
Research LAB No.15-E-3, May 1, 2015
Keywords:
Natural yield curve; Yield curve gap; Natural rate of interest; Interest rate gap
JEL Classification:
C32, E43, E52, E58
Contact:
kei.imakubo@boj.or.jp (Kei Imakubo)
Abstract
Recent monetary policies aiming to influence the entire yield curve have come to play a more prominent role in advanced economies as there has been little room for further lowering the short-term interest rate. This means that the effects of monetary easing cannot be fully captured by the single gap between the actual real short-term rate of interest and the corresponding natural rate of interest. This article proposes the concept of the natural yield curve, which extends the idea of the natural rate of interest defined at a specific maturity to one defined for all maturities. The gap between the actual real yield curve and the natural yield curve enables us to measure not only the effects of conventional monetary policy through short-term interest rate control but also those of unconventional monetary policy through government bond purchases and forward guidance.
Introduction
The natural rate of interest or the equilibrium rate of interest is the real interest rate at which the economy neither accelerates nor decelerates. If the actual real rate of interest is above the natural rate of interest, the interest rate gap will put downward pressure on output, and vice versa. This characteristic makes the natural rate of interest a reference point for the central bank in controlling the short-term interest rate. Many central bankers and researchers have attempted to estimate the natural rate of interest using various methods (e.g., Laubach and Williams, 2003). Also, researchers at the Bank of Japan, such as Oda and Muranaga (2003) and Kamada (2009), have estimated the natural rate of interest for Japan.
Since the 2000s, however, Japan's nominal short-term rate has hit the zero lower bound and there has hence been no room for a further decline. In such an environment, the gap between the actual real rate of interest at a specific maturity -- such as the overnight rate -- and the corresponding natural rate of interest cannot be used for consistently evaluating the effects of monetary easing. A different measure is therefore needed to overcome this limitation. The purpose of this article is to propose the natural yield curve, which is an extension of the idea of the conventional natural rate of interest.
Yield curve responses to monetary easing
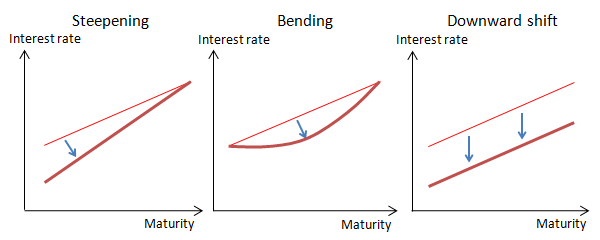
Yield curve responses to monetary easing can be categorized into three types: the steepening, bending, or downward shift of the yield curve. A graphic illustration of these responses is provided in Figure 1. A steepening implies that the slope of the yield curve becomes steeper with a decline of the short-term interest rate. This is a typical response to a policy rate cut by the central bank. A bending of the yield curve means that medium-term yields decline, resulting in a crescent-shaped curve. This can happen as a result of forward guidance or a commitment by the central bank to keep its policy expansionary and is observed when market participants expect that the low-interest-rate policy will be kept in place for some time to come. Finally, a downward shift is a parallel downward shift in the entire yield curve, which occurs when the central bank puts downward pressure on the entire yield curve by purchasing long-term government bonds.
Figure 1. Typical yield curve responses
The effects of monetary easing on the economy are likely to differ depending on the way in which the yield curve responds. Moreover, in practice, changes in the yield curve tend to be a complex combination of these three responses. Therefore, information on the extent to which interest rates on a specific term decline is insufficient to evaluate the effects of monetary easing on the entire yield curve. To gauge the overall effects of monetary easing, information on changes in the entire yield curve is needed.
Basic properties of the natural yield curve
Just as the natural rate of interest is defined as the real interest rate at which the economy neither accelerates nor decelerates, so the natural yield curve, which is consistent with the equilibrium of supply and demand, is defined as the real yield curve at which the economy neither accelerates nor decelerates. If the actual real yield curve matches the natural yield curve, the output gap will converge to zero. On the other hand, if the actual real yield curve lies above the natural yield curve, meaning that there is a positive yield curve gap, financial conditions are contractionary, leading to a worsening in the output gap. By contrast, if the actual real yield curve lies below the natural yield curve, meaning that there is a negative yield curve gap, financial conditions are accommodative, leading to an improvement in the output gap.
The level and shape of the natural yield curve vary depending on economic activity and expectations of future economic growth. For example, strong economic activity will be associated with a higher natural yield curve. Conversely, weak economic activity due to heightened uncertainty regarding future economic conditions will be associated with a lower natural yield curve. Moreover, if future economic growth is expected to be higher than current growth, the natural yield curve will be steeper. Conversely, if it is expected to be lower, the natural yield curve will be flatter.
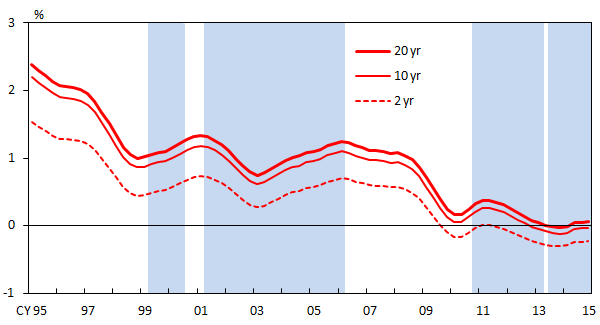
In order to estimate the natural yield curve for Japan, we employ the natural yield curve model developed in Imakubo et al. (2015) [PDF 521KB], which is an extension of Laubach and Williams' (2003) model for the conventional natural rate of interest (see also Brzoza-Brzezina and Kotlowski, 2014, for another type of natural yield curve model). The model allows us to estimate the natural yield curve from the IS curve, which describes the relationship between the yield curve gap and the output gap. The yields for selected terms on the estimated natural yield curve are shown in Figure 2, which plots the yields for 2, 10, and 20 years to maturity (representing the medium, long, and super-long term) over time. As can be seen, the natural rates of interest for all horizons have declined to around zero. At the same time, the term spread between 2- and 10-year natural rates of interest has narrowed, indicating a flattening of the natural yield curve from the medium to the long term. Both the downward shift and the flattening of the natural yield curve are attributable to the downward revision of the outlook for economic activity since the 1990s. Note that, in estimating the natural yield curve, we use interest rates deflated by survey-based inflation expectations instead of directly observed market-based real interest rates. The estimates should thus be interpreted with some latitude.
Figure 2. Yields for selected terms on the natural yield curve
Note: The shaded areas indicate, from left to right, the zero interest rate policy, quantitative easing, comprehensive monetary easing, and quantitative and qualitative monetary easing.
Comparison of monetary easing programs
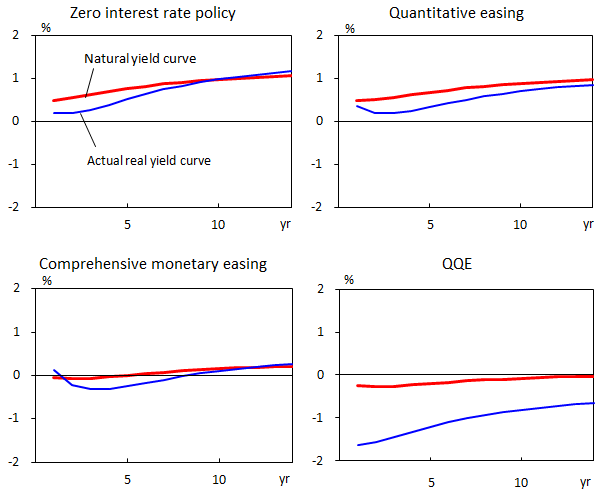
Since the 1990s, four monetary easing programs have been implemented in Japan: the zero interest rate policy from 1999 to 2000, the quantitative easing policy from 2001 to 2006, the comprehensive monetary easing policy from 2010 to 2013, and the quantitative and qualitative monetary easing (QQE) policy from 2013 onward. Figure 3 shows the relationship between the natural yield curve and the actual real yield curve for each of these programs. During the zero interest rate policy period, the Bank of Japan induced a negative yield curve gap mainly for short maturities via its policy rate. The next two programs, the quantitative easing and the comprehensive monetary easing programs, resulted in a negative gap for medium rather than short maturities. This implies that the monetary easing effects of these two programs were achieved mainly through the Bank of Japan's commitment to keep its policy expansionary for some time. In addition, under the comprehensive monetary easing program, the Bank of Japan's purchases of government bonds with up to 3-year maturity also contributed to the decline in the yields for medium maturities.
Figure 3. Yield curves during each of the monetary easing programs
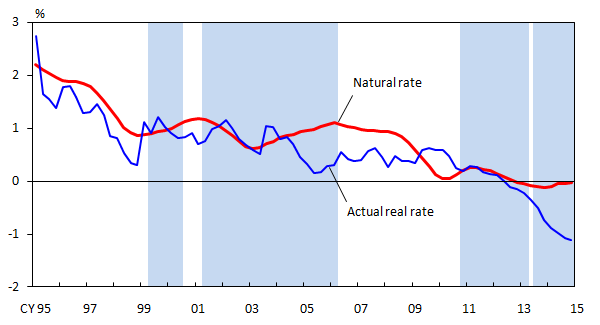
Finally, the current QQE program has resulted in a considerable negative yield curve gap for long maturities as well as short and medium maturities. Consequently, the QQE program has led to the most accommodative financial conditions of the four programs. Specifically, as shown in Figure 4, the 10-year actual real rate of interest has considerably declined in the nearly two years since the introduction of the QQE program while the corresponding natural rate of interest has been flat, causing the interest rate gap between the two to expand by about 90 basis points. This is the fastest pace of expansion during any of the four programs.
Figure 4. The 10-year natural rate and actual real rate
Note: The shaded areas indicate, from left to right, the zero interest rate policy, quantitative easing, comprehensive monetary easing, and QQE.
Measuring the interest rate environment
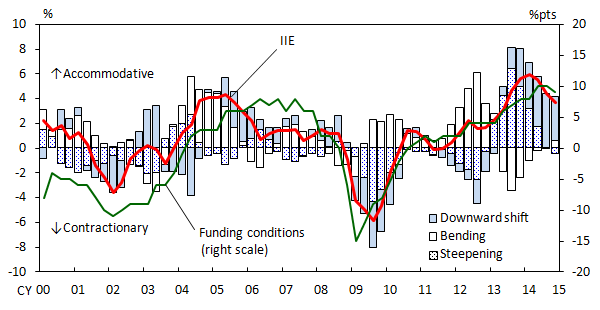
To measure how accommodative financial conditions are, we construct an indicator of the interest rate environment (IIE), which aggregates information on the interest rate gaps for all maturities. Specifically, we define the IIE as the potential effects on the current and future output gap of the yield curve gap at each point in time. The IIE therefore can be used as an indicator to measure not only to what extent the financial conditions implied by the entire yield curve are accommodative, but also the long-run impact of financial conditions on the output gap. By definition, an IIE of zero percent implies that financial conditions are neutral for economic activity. If the IIE is positive, the financial conditions implied by the entire yield curve can be viewed as accommodative and as conductive to improving the output gap. Conversely, if the IIE is negative, financial conditions can be regarded as contractionary.
Figure 5. The IIE and firms' funding conditions
Note: The figure shows the 4-quarter moving average of the IIE. Firms' funding conditions are represented by the D.I. for firms' financial position.
Source: Bank of Japan, "Tankan, Short-term Economic Survey of Enterprises in Japan."
Unlike interest rate gaps for a specific maturity, the IIE derived from the entire yield curve provides a good indicator of developments in financial conditions. As shown in Figure 5, developments in the IIE are similar to those in firms' funding conditions, another indicator measuring financial conditions. Decomposition of the IIE indicates that under the quantitative easing and the comprehensive monetary easing programs the Bank of Japan's commitment policy played a key role in the decline of medium-term yields, i.e., the bending of the yield curve. On the other hand, under the QQE program, the Bank of Japan's long-term government bond purchases have had major effects, and the positive contribution of the resulting downward shift of the yield curve to the output gap greatly exceeds its historical average. Our natural yield curve model implies that the impact of the overall QQE program on the output gap is equivalent to that of a steepening of the yield curve with a reduction in the short-term interest rate of 190 basis points.
Concluding remarks
Since the global financial crisis, the focus of monetary policy by major central banks has shifted to the entire yield curve from the short-term interest rate. Against this background, the concept of the natural yield curve has become more important than that of the conventional natural rate of interest. The natural yield curve is expected to provide a useful benchmark in the conduct of both conventional and unconventional monetary policy.
References
- Brzoza-Brzezina, M. and J. Kotlowski (2014), "Measuring the natural yield curve," Applied Economics, 46(17), pp. 2052-2065.
- Imakubo, K., H. Kojima, and J. Nakajima (2015), "The natural yield curve: its concept and measurement [PDF 521KB]," Bank of Japan Working Paper Series, No. 15-E-5.
- Kamada, K. (2009), "Japan's equilibrium real interest rate," in K. Fukao (Ed.), Macroeconomy and Industrial Structures, pp. 387-427, Keio University Press (in Japanese).
- Laubach, T. and J. C. Williams (2003), "Measuring the natural rate of interest," Review of Economics and Statistics, 85(4), pp. 1063-1070.
- Oda, N. and J. Muranaga (2003), "On the natural rate of interest: theory and estimates," Bank of Japan Working Paper Series, No. 03-J-5 (in Japanese).
Notice
The views expressed herein are those of the authors and do not necessarily reflect those of the Bank of Japan.

