Long-Term Unemployment in Japan
Saori Naganuma, Yosuke Uno (Bank of Japan)
Research LAB No.16-E-1, April 13, 2016
Keywords: Long-term unemployment; Mismatch; Nominal wages
JEL Classification: E24, J64
Contact: yousuke.uno@boj.or.jp (Yosuke Uno)
Abstract
Japan's unemployment rate is now historically low, but long-term unemployment has been slow to decline. Long-term unemployment in Japan, unlike that in the United States, is biased towards "young adult men." This is partly because with shifts in labor demand across industries and employment status, young adult men retrenched by manufacturers have been unable to find the same manufacturing occupations and thus remain jobless for longer periods. Moreover, many in the generation represented by the so-called "freeze in hiring period" have been able to spend more time looking for work due to support from family members. Although the impact of the long-term unemployed on nominal wages is limited, it should be noted that future income levels of the long-term unemployed may remain low, and that the lack of human capital accumulation may exert a negative impact on the growth rate.
Introduction
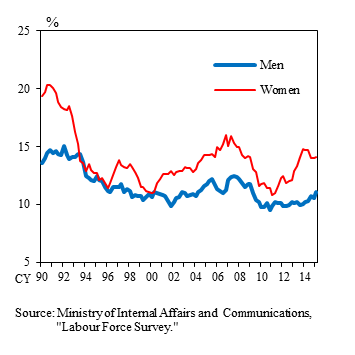
Japan's unemployment rate is now historically low at around 3 percent and labor shortages among firms have deepened considerably (Figure 1). Nevertheless, a detailed breakdown shows that in contrast to the sharp decline in the number of short-term unemployed - for a period of less than one year - the pace of decline in the long-term unemployed - for one year and over - has been extremely sluggish (Figure 2). As a result, the share of the long-term unemployed has been on an upward trend since the 1990s, recently moving ahead of the United States and United Kingdom (Figure 3). In addition, the share of the super-long-term unemployed - for two years and over - exceeded 20 percent in 2014, with the average unemployment duration continuing to lengthen.
Figure 1: Unemployment rate and employment conditions
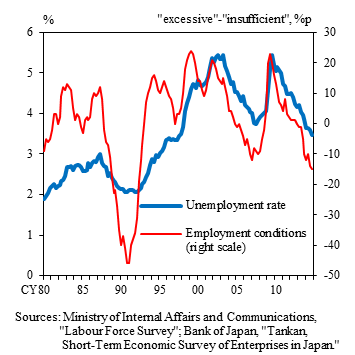
Figure 2: Number of short- and long-term unemployed
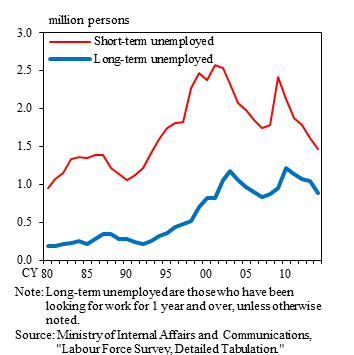
Figure 3: Share of long-term unemployed in selected countries
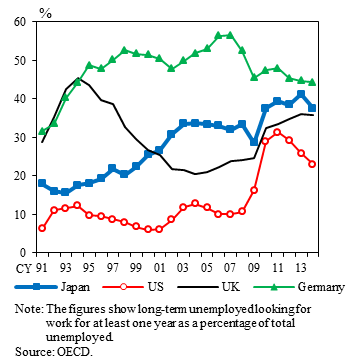
In the United States and United Kingdom, the share of long-term unemployment jumped after the 2008 global financial crisis (Figure 3) and questions on how extended unemployment spells have affected employment, wages, and prices have since been highly relevant in monetary policy discussions.1 For example, Krueger et al. (2014) documented that in the case of the United States, the long-term unemployed are only marginally attached to the labor force by comparison with the short-term unemployed and hence not sensitive to the business cycle, implying that the rise in long-term unemployment after the global financial crisis is attributable to a structural factor. Kumar and Orrenius (2015), using U.S. state-level data, showed that the long-term unemployment rate exerts less influence on real wage changes than the short-term unemployment rate. Linder et al. (2014) also argued that the short-term unemployment rate can predict nominal wages more precisely than the overall unemployment rate. These studies are consistent with the argument that long-term unemployment rates do not affect labor market tightness. On the other hand, Dent et al. (2014) emphasized that the long-term unemployed are not less attached to the labor market than the short-term unemployed, comparing several observable characteristics (e.g., age composition) between the two. Consistent with this view, Kiley (2014) finds that downward pressure on prices from increasing long-term unemployment rates does not differ significantly from that associated with short-term unemployment rates.
In this post, following the above-mentioned previous studies in the United States, we analyze the factors behind fluctuations in long-term unemployment in Japan, and then evaluate their impact on nominal wages based on Phillips curve estimation results.
- In the United States, there has also been some debate on whether a transitory extension of unemployment insurance benefits caused an increase in long-term unemployed after the global financial crisis, although there is no clear consensus on the quantitative impact (Fujita [2011], Farber and Valletta [2013]).
Characteristics of the long-term unemployed in Japan
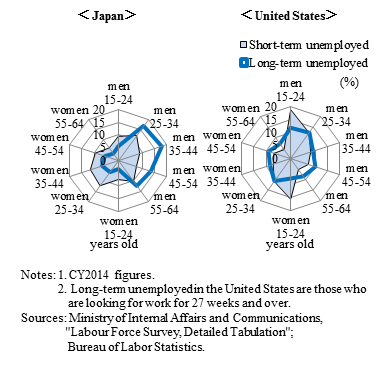
We begin by observing basic characteristics of the long-term unemployed in comparison to the short-term unemployed in Japan. Comparing profiles of the long-term and short-term unemployed as of 2014, the distribution of the short-term unemployed is spread out almost uniformly in terms of sex and age cohort, whereas that of the long-term unemployed is biased heavily towards "men aged 25 to 44 years" (Figure 4). This is a marked difference from the United States, where the profile of the long-term unemployed is distributed almost uniformly across sex and age cohort.
Figure 4: Characteristics of the long-term unemployed by sex and age cohort
We find that this biased profile of the long-term unemployed has been a sustained trend since the 1990s. Men's share of the long-term unemployed since the 1990s has remained at about 70 percent, significantly higher than that of the short-term unemployed (approximately 50 percent). The share of long-term unemployed men aged 25-44 has also remained high since the 1990s, constituting roughly 30 percent of total long-term unemployment. Consistent with this longer unemployment duration among men, the male job finding rate in Japan (i.e., the probability that an unemployed worker will find a job in the next month) has been on a downward trend since the 1990s (Figure 5). It should be noted that the number of long-term unemployed men aged 25-44 climbed steadily from about 60,000 in the early 1990s to a peak of around 430,000 in 2010 and still stands at some 310,000 persons as of 2014.
Figure 5: Job finding rate
Background to disproportionate representation of males in the long-term unemployed
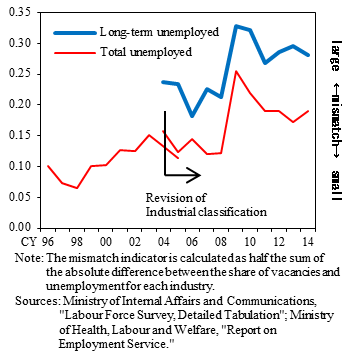
Why is men's share of the long-term unemployed so high? Labor market mismatches could be one explanation. Labor demand in Japan has been sluggish in the manufacturing industry, while it has significantly increased in the services industry including the medical, health care and welfare sector, resulting in a shift in labor demand across industries (Figure 6). Taking account of the tendency for unemployed workers to seek jobs similar to their previous ones, this labor demand shift has made it difficult for workers retrenched by manufacturers to find the same type of job in that particular industry. In fact, 25 percent of the long-term unemployed are from the manufacturing industry as of 2014. Since the proportion of male workers is high in the manufacturing industry, this industrial mismatch may have made men's unemployment duration longer. In fact, a mismatch indicator - derived from the difference between the numbers of job offers and job seekers - reveals that the mismatch among long-term unemployed workers is larger than that for the total unemployed population (Figure 7).
Figure 6: New job openings by industry
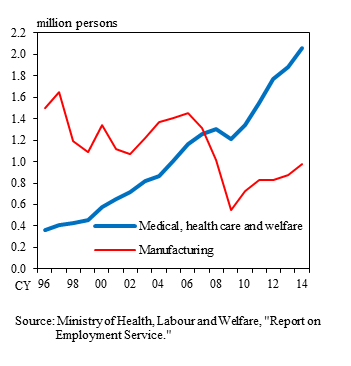
Figure 7: Mismatch indicator
In light of the higher share of part-time employment in the services industry than that in manufacturing, a labor demand shift from manufacturing to services implies greater demand for part-time (as opposed to regular) employment. Since the proportion of men seeking regular employment is higher than that of women,2 this labor demand shift from regular to part-time employment may have led to long-term unemployment among men. Thus, the high share of men among the long-term unemployed arises from a mismatch across industries and employment status.
- 2 According to the Ministry of Internal Affairs and Communications, "Employment Status Survey (2012)," the share of job seekers wishing to work as regular employees was 26 percent for women and 54 percent for men.
Background to disproportionate representation of young adults in the long-term unemployed
As shown above, men and relatively young adults aged 25-44 are overrepresented in the population of long-term unemployed in Japan. This is partly because many of these unemployed young adults are receiving some sort of financial assistance from their live-in parents, thereby enabling them to spend a relatively long period of time looking for work. In fact, the share of "child of household head" among the long-term unemployed exceeded 50 percent as of 2014 versus around 40 percent for the short-term unemployed. In addition, a survey conducted on the long-term unemployed in 2013 by The Japan Institute for Labour Policy and Training showed that among those aged 39 years and under, roughly half were receiving assistance from their live-in family members. In general, this financial assistance raises the reservation wage (i.e., the minimum wage level at which a job offer will be accepted), which in turn extends the duration of unemployment.
Looking at another aspect of the high share for young adults, we observe that they are the generation that participated in the labor market as new graduates during the so-called "freeze in hiring period" (mainly referring to the period from 1993 to 2005). Genda, Kondo, and Ohta (2010) documented that this generation struggled to find full-time positions as new graduates and consequently had only limited opportunity to accumulate human capital through on-the-job training. Moreover, the fact that they had no work history as new graduates conveyed a negative signal to firms. It is likely that these negative influences (i.e., hysteresis effects) have continued to prevail to this day. In fact, the "aged 25 to 34 years" share of the long-term unemployed began rising in the mid-1990s, and this has been followed by an increase in the "aged 35 to 44 years" cohort since the turn of the century. This lag suggests that long unemployment duration may be a phenomenon specific to this generation.
Impact of long-term unemployment on nominal wages
How does an increase in the long-term unemployed impact nominal wages? Here, we estimate a simple Phillips curve (i.e., the relationship between nominal wages and short- and long-term unemployment rates), using panel data by sex and age cohort to obtain precise estimates.3
We obtain a statistically significant and negative coefficient on short-term unemployment, but find that long-term unemployment does not exert a statistically significant pressure on nominal wages (Table 1). This result is consistent with our above argument. That is, the long-term unemployed in Japan are less likely to find employment opportunities generated by a cyclical recovery in labor demand owing to (1) mismatches in the labor market and (2) hysteresis effects caused by the "freeze in hiring period." Accordingly, the long-term unemployment rate generates less downward pressure on nominal wages than the short-term rate.
Table 1: Estimation result of a Phillips curve
| Coefficient | Short-term unemployment rate | Long-term unemployment rate | Adj-R2 | |||
|---|---|---|---|---|---|---|
| 0.02 | *** | -3.53 | ** | -0.82 | 0.78 | |
| (0.00) | (1.46) | (1.88) | ||||
Notes:
- **, *** indicate significance at the 5% and 1% levels, respectively. Parentheses indicate standard errors.
- Data are by sex and 10 year age brackets. Fixed effect model. Sample period is CY 1982-CY2014.
However, even if the effects on nominal wages are limited, it should be noted that future income levels of the long-term unemployed may remain low, and that the lack of human capital accumulation may exert a negative impact on the growth rate.4
- 3 As shown in the Figure 2, short- and long-term unemployment rates are highly correlated, making estimation difficult in small samples. Using panel data can be one of solutions to overcome strong co-linearity between the two (see Kiley [2014], Kumar and Orrenius [2015]).
- 4 For instance, a survey conducted by The Japan Institute for Labour Policy and Training shows that the average annual income of the long-term unemployed was about 3.6 million yen prior to labor force withdrawal, while it dropped to roughly 2.4 million yen after re-entry.
Conclusion
In this post, we documented current developments of the long-term unemployed in Japan and then analyzed their impact on nominal wages. We find that "young adult men" are heavily overrepresented among the long-term unemployed in Japan and that this has been an observable trend since the 1990s. This biased profile of the long-term unemployed is due mainly to: (i) a structural mismatch in the labor market across industries and employment status; (ii) elevated reservation wages due to financial assistance from live-in parents; and (iii) hysteresis effects dating back to the "freeze in hiring period." In light of these factors, the long-term unemployed in Japan are less likely than the short-term unemployed to enjoy the benefits of increased employment opportunities arising from a cyclical recovery in labor demand. In fact, as shown in our estimation results for a simple Phillips curve, the effects of the long-term unemployment rate on nominal wages were limited by comparison with the short-term rate. However, even if the effects on nominal wages are limited, it should be noted that future income levels of the long-term unemployed may remain low, and that the lack of human capital accumulation may exert a negative impact on the growth rate.
References
- Genda, Yuji, Ayako Kondo, and Souichi Ohta (2010) "Long-Term Effects of a Recession at Labor Market Entry in Japan and the United States," Journal of Human Resources, Vol.45, No.1, pp.157-196.
- The Japan Institute for Labour Policy and Training (2015) "Choki Shitsugyosha no Kyushoku Katsudo to Saishushoku Jyokyo [PDF 1.26MB] (Link to an external website)," JILPT Research Report, No.133. (in Japanese)
- Dent, Rob, Samuel Kapon, Faith Karahan, Benjamin W. Pugsley, and Aysegul Sahin (2014) "Measuring Labor Market Slack: Are the Long-Term Unemployed Different? (Link to an external website)," Liberty Street Economics, Federal Reserve Bank of New York.
- Farber, Henry S. and Robert G. Valletta (2013) "Do Extended Unemployment Benefits Lengthen Unemployment Spells? Evidence from Recent Cycles in the U. S. Labor Market [PDF 583KB] (Link to an external website)," Working Paper Series, Federal Reserve Bank of San Francisco.
- Fujita, Shigeru (2011) "Effects of Extended Unemployment Insurance Benefits: Evidence from the Monthly CPS [PDF 211KB] (Link to an external website)," Working Papers, Federal Reserve Bank of Philadelphia.
- Kiley, Michael T. (2014) "An Evaluation of the Inflationary Pressure Associated with Short- and Long-term Unemployment [PDF 149KB] (Link to an external website)," Finance and Economics Discussion Series, 2014-28, Federal Reserve Board.
- Krueger, Alan B., Judd Cramer, and David Cho (2014) "Are the Long-Term Unemployed on the Margins of the Labor Market?" Brookings Papers on Economic Activity, Spring 2014, pp.229-299.
- Kumar, Anil and Pia M. Orrenius (2015) "A Closer Look at the Phillips Curve Using State-level Data," Journal of Macroeconomics, Vol.47, pp.84-102.
- Linder, M. Henry, Richard Peach, and Robert Rich (2014) "The Long and Short of It: The Impact of Unemployment Duration on Compensation Growth (Link to an external website)," Liberty Street Economics, Federal Reserve Bank of New York.
Notice
The views expressed herein are those of the authors and do not necessarily reflect those of the Bank of Japan.