Recent Developments in Measuring Inflation Expectations: With a Focus on Market-based Inflation Expectations and the Term Structure of Inflation Expectations
ADACHI Ko, HIRAKI Kazuhiro (Bank of Japan)
Research LAB No.21-E-1, June 25, 2021
Keywords: Inflation expectations; Survey-based inflation expectations; Breakeven inflation rate
JEL Classification: C32, D84, E31, E43, E52, G12
Contact: kazuhiro.hiraki@boj.or.jp (HIRAKI Kazuhiro)
Summary
Economic surveys and the market price of inflation-linked assets are two major sources for gauging inflation expectations. Recent studies have developed methodologies that use various indicators to estimate underlying inflation expectations and their term structure. This article reviews recent research on inflation expectations, with a focus on Hiraki and Hirata's (2020) [PDF 2,492KB] study on market-based inflation expectations, and Maruyama and Suganuma's (2019) [PDF 833KB] study on the term structure of inflation expectations. We also describe recent movements in inflation expectations in Japan.
Overall, inflation expectations weakened somewhat after the outbreak of COVID-19 in early 2020, but they have been more or less unchanged in recent months. Given the great uncertainty over the consequences of COVID-19 and their impact on domestic and overseas economies, future developments in inflation expectations will also continue to be highly uncertain. It is therefore important to continue monitoring the various indicators of inflation expectations by considering their characteristics.
Introduction
People's expectations about future inflation rates are called inflation expectations. The role played by inflation expectations is important when considering price stability and the effects of monetary policy. For example, inflation expectations affect realized inflation through their impact on firms' price and wage setting behaviors. Moreover, the real interest rate, which is the difference between the nominal interest rate and inflation expectations, is one of the key determinants of investment and consumption decisions. Given the crucial role played by inflation expectations, it is essential to understand how these expectations develop.1 This is particularly the case since early 2020, as the spread of COVID-19 has had a dramatic impact on domestic and overseas economies.
While inflation expectations are not directly observable, economic surveys and the market price of inflation-linked assets (e.g., inflation-linked government bonds) have been used to gauge inflation expectations.2 Meanwhile, a growing literature has investigated the characteristics of the indicators of inflation expectations and the expectation formation mechanisms behind these indicators. Furthermore, recent studies have developed methodologies to estimate underlying inflation expectations and their term structure from various indicators. Deepening our understanding of these indicators through existing studies is essential to correctly evaluate developments in inflation expectations.
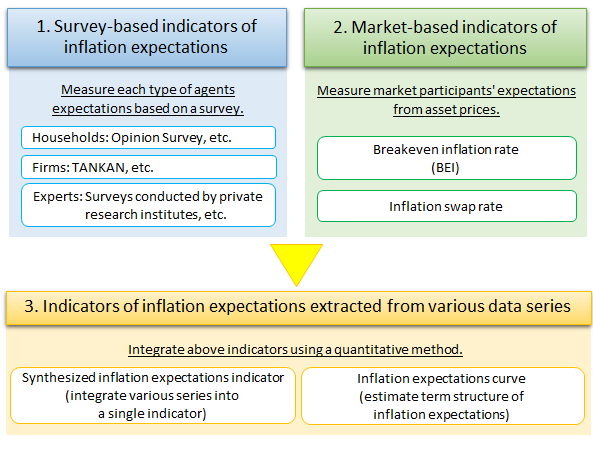
In this article, we begin by providing an overview of recent research on the two major types of indicators of inflation expectations, survey-based indicators and market-based indicators (Figure 1), and report their recent movements. Next, we describe the indicators of underlying inflation expectations and their term structure extracted from various observable data series. We then summarize recent developments in underlying inflation expectations based on these extracted indicators.
Figure 1 : Various indicators of inflation expectations in Japan
- See Sekine et al. (2008) and Bernanke (2007) among others, for detailed explanations of the importance of inflation expectations in the conduct of monetary policy.
- In addition to these quantitative indicators of inflation expectations, the stance of households and firms on price fluctuations, such as households' tolerance of price rises and firms' judgement on their own product prices, is also important data to understand developments in inflation expectations.
Survey-based indicators of inflation expectations
One of the major sources to gauge inflation expectations is economic surveys of households, firms, and experts. We outline recent studies of survey-based indicators by the type of economic agent. We then report recent movements in survey-based indicators of inflation expectations in Japan.
To begin with, some studies point out that households' inflation expectations are affected by the price of goods they frequently purchase. In addition, reporting biases have been found in households' inflation expectations (e.g., households tend to answer 0, or in multiples of 5).3 Nishiguchi et al. (2014) among others develop econometric methodologies to extract households' inflation expectations by adjusting reporting biases.
Next, while the inflation expectations of price-setters of goods and services (i.e., firms) are especially important, large-scale and continuous surveys were limited until recently. However, after quantitative questions on inflation expectations were added to the Bank of Japan's survey, "Short-Term Economic Survey of Enterprises in Japan" (TANKAN), in 2014, a number of studies have analyzed firms' inflation expectations using the large-scale panel data from the TANKAN (e.g., Uno et al., 2018; Inatsugu et al., 2019). These studies suggest that Japanese firms form their inflation expectations in a complex manner that cannot be described by a single theory such as the sticky information hypothesis or the noisy information hypothesis.4
Finally, inflation expectations of experts (e.g., economists) are responsive to changes in monetary policy, as their expectations are based on their professional understanding of the economy and monetary policy (Coibion et al., 2020). In addition, Carroll (2003) points out that experts' inflation expectations affect other agents' inflation expectations. Therefore, although experts are neither price-setters nor consumers, it is helpful to observe developments in their inflation expectations.
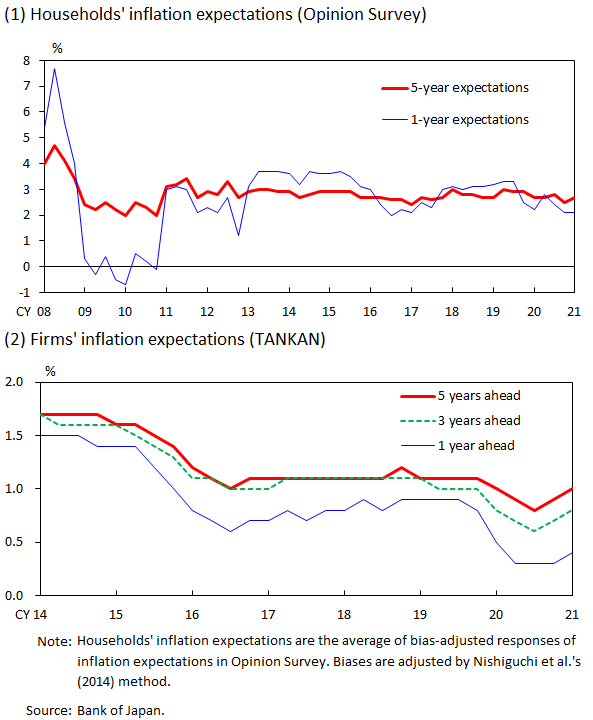
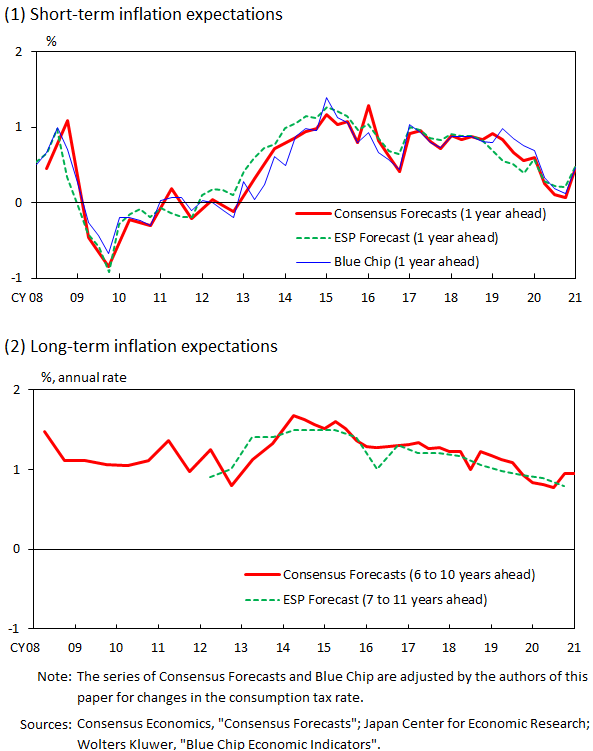
Figures 2 and 3 illustrate the time-series of survey-based indicators of inflation expectations. Specifically, Figure 2(1) shows bias-adjusted households' inflation expectations using Nishiguchi et al.'s (2014) method. Figures 2(2) and 3 illustrate inflation expectations of firms and experts, respectively. As these figures show, regardless of the type of agent, inflation expectations had been more or less unchanged prior to the COVID-19 outbreak. Subsequently, between the spring and the summer of 2020, when COVID-19 was spreading globally, the inflation expectations of firms and experts decreased. In contrast, there were countries that saw an increase in households' inflation expectations (Candia et al., 2020); Japanese households' short-term inflation expectations also increased temporarily. Since the mid-2020, inflation expectations indicators had weakened somewhat regardless of the type of agent, and they have been more or less unchanged in recent months.
Figure 2 : Inflation expectations of households and firms
Figure 3 : Inflation expectations of experts
- 3Some studies show that respondents' characteristics (e.g., age) are also determinants of households' inflation expectations (e.g., Diamond et al., 2020; Bank of Japan, 2021).
- 4For an analysis of firms' inflation expectations in the U.S., see Candia et al. (2021).
Market-based indicators of inflation expectations
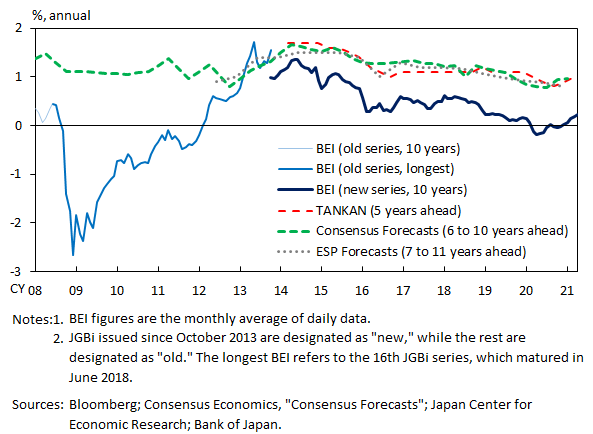
An alternative approach to measuring inflation expectations is to use the market price of inflation-linked assets. A representative indicator of this category is the breakeven inflation rate (BEI), which is the difference between the interest rate of nominal and inflation-linked government bonds.5 One advantage of BEI, compared with survey-based indicators, is that BEI can be observed with high frequency and without publication lag. On the other hand, as we will explain shortly, BEI can deviate from market participants' inflation expectations due to financial asset-specific factors such as liquidity premium (e.g., Bernanke, 2004; Yellen, 2015). Caution is also necessary when using BEI for evaluation in Japan, as it has tended to give lower figures than survey-based measures (Figure 4). Below, we explain how inflation expectations of market participants should be measured, based on Hiraki and Hirata's (2020) extensive study on BEI.
Figure 4 : Comparison between BEI and survey-based inflation expectations
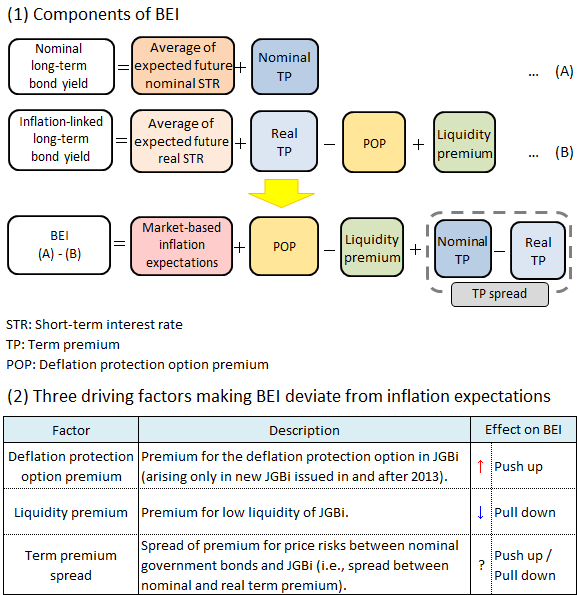
In addition to market participants' inflation expectations, three driving factors affect BEI (Figure 5). The first driving factor is the deflation protection option premium of inflation-linked bonds. The Japanese inflation-linked bonds, JGBi, issued in and after 2013 have a principal protection feature. These JGBi would redeem their initial principal amount even if the price index decreased between the issuance and maturity. This protection option value pushes up BEI. The second driving factor is the liquidity premium of inflation-linked bonds. Since investors typically demand an additional premium for trading relatively illiquid inflation-linked bonds (compared with nominal bonds), the liquidity premium lowers BEI. The last driving factor is the term premium spread, that is, the spread between the nominal and the real term premium. Term premia are the risk premia for price risks in long-term government bonds, and BEI is affected by the difference between the nominal and real term premium. Existing studies show that the term premium spread can push up or pull down BEI.
Figure 5 : Factors affecting BEI
The three driving factors and the market participants' inflation expectations, obtained by adjusting for the three driving factors of BEI, are estimated using an affine term structure model. An affine term structure model is a widely used technique in the analysis of the term structure of interest rates, which expresses the term structure based on a number of factors, typically between three and five. Hiraki and Hirata (2020) employ a five-factor model that includes two factors each for the nominal and real term structure (four factors in total), and a fifth factor that explains the liquidity premium of JGBi. Due to data limitations caused partly by the suspension of the issuance of JGBi, there have been no studies that estimate the three driving factors of BEI simultaneously. Hiraki and Hirata (2020) circumvent these difficulties and simultaneously estimate the three driving factors by utilizing inflation swap data in addition to JGBi data.6
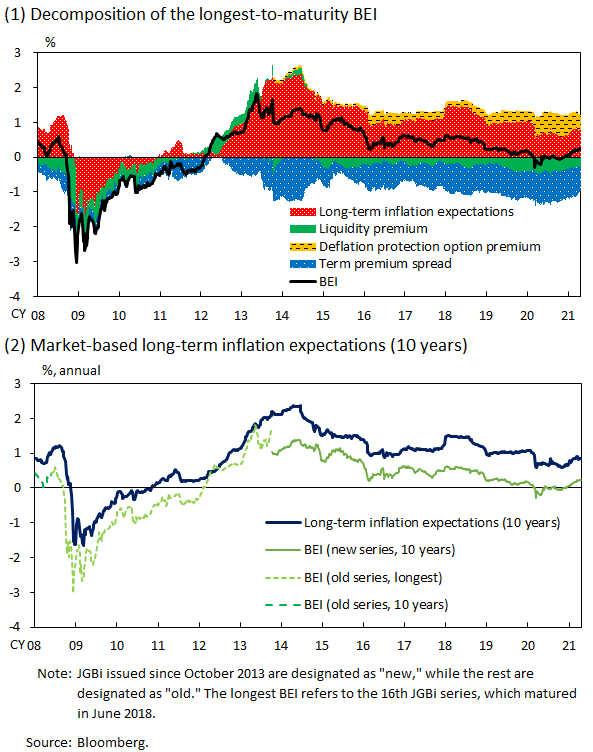
Figure 6 shows the estimation results based on their method. Figure 6(1) shows that all three driving factors have a non-negligible impact on BEI. Specifically, the deflation protection option premium pushes up BEI, while the liquidity premium and the term premium spread pull down BEI. Moreover, Figure 6(2) shows that market-based inflation expectations, which adjust for the three driving factors of BEI, have evolved higher than BEI. These results suggest that BEI deviates downward from market-based inflation expectations.
Figure 6 : Results of estimation based on Hiraki and Hirata's (2020) method
The estimated market-based inflation expectations had weakened somewhat since March 2020, because of the pandemic, but have increased slightly since January 2021. These developments may partly reflect large fluctuations in oil prices; existing studies document that market-based inflation expectations are responsive to changes in oil prices.
- 5An inflation-linked derivative, inflation swap, can also be used as a market-based indicator of inflation expectations.
- 6For an analysis of the U.S. BEI, see Andreasen et al. (2020).
Indicators of inflation expectations extracted from various data series, and their term structure
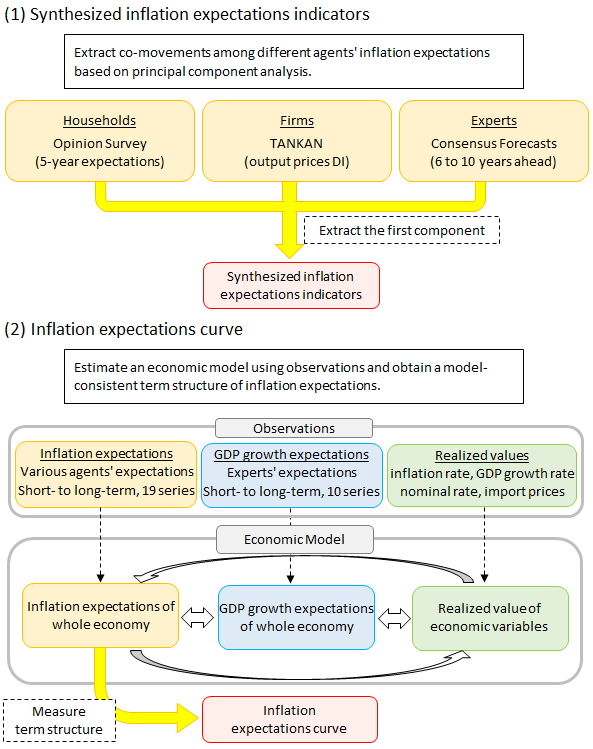
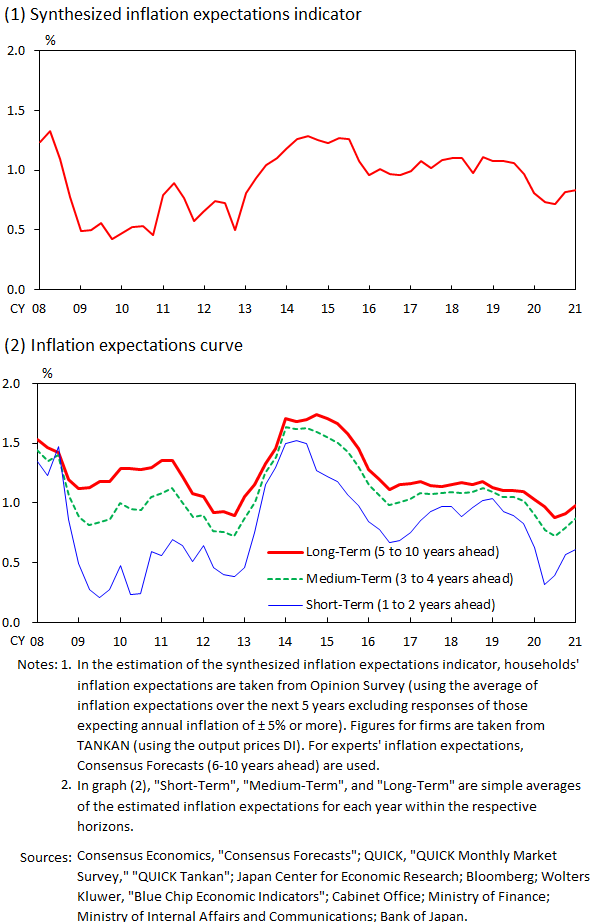
Considering the aforementioned diverse characteristics of individual indicators of inflation expectations, it is important to understand developments in common underlying inflation expectations across various indicators, in addition to following individual indicators. From this perspective, the Federal Reserve Board (FRB), among others, has been developing methodologies to extract a single indicator of underlying inflation expectations from various indicators.7 With regard to Japanese data, Nishino et al. (2016) develop the synthesized inflation expectations indicators. This method extracts co-movements among the inflation expectations of households, firms, and experts using principal component analysis. They use the first principal component as an indicator of underlying inflation expectations (Figure 7(1)).
Figure 7 : Methods to extract indicators of inflation expectations from various data series
More recent studies have developed techniques to estimate the term structure of underlying inflation expectations by aggregating various indicators consistently by taking into account the differences in their expectation horizons. An application of this approach in Japan is the inflation expectations curve proposed by Maruyama and Suganuma (2019). They estimate the term structure of inflation expectations based on 19 indicators of inflation expectations of various horizons (Figure 7(2)). They assume an economic model between inflation expectations and the realized or expected values of other economic variables (e.g., GDP growth expectations, nominal interest rate), and estimate the term structure of inflation expectations behind the observations using a state space model.
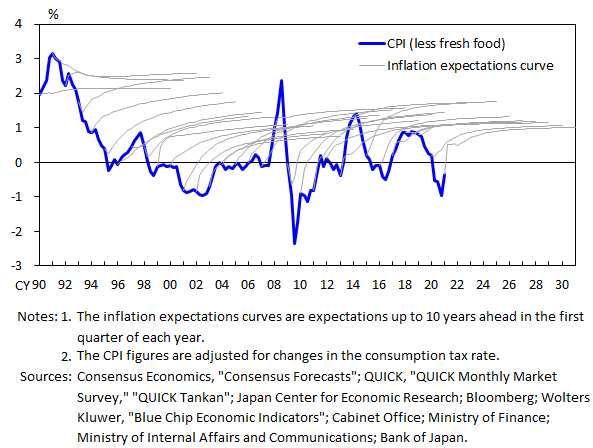
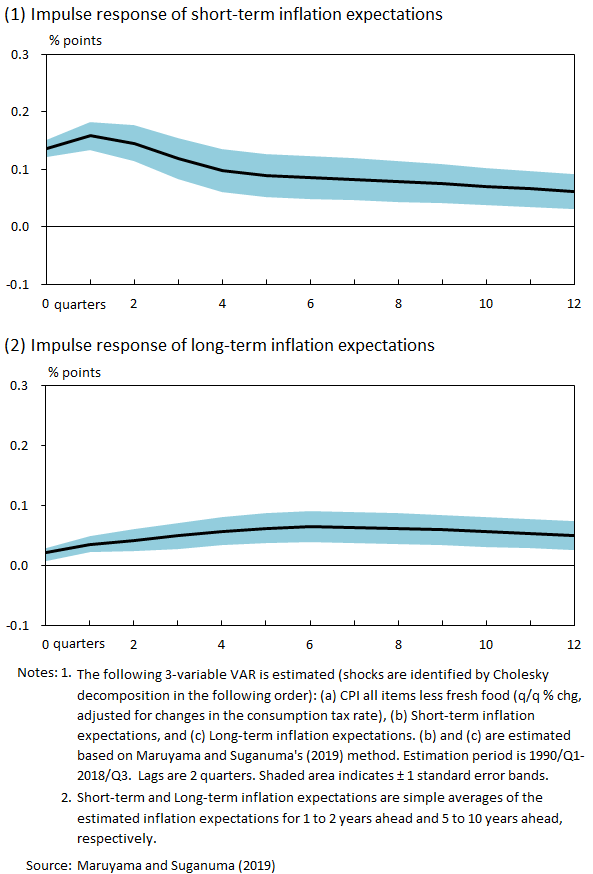
Figure 8 shows the estimated term structure of inflation expectations up to 10 years ahead (gray thin line). Most of the time, the term structure exhibits a right-side up shape, similar to existing studies of the United States (e.g., Crump et al., 2018). Figure 9 shows the responses of short- and long-term inflation expectations estimated by Maruyama and Suganuma's (2019) method to a positive shock in realized inflation, using a vector autoregression. Figure 9 shows that a positive shock in realized inflation persistently increases inflation expectations for both time horizons. This result suggests that the adaptive expectation formation has a strong influence on both short- and long-term inflation expectations in Japan.
Figure 8 : Term structure of inflation expectations
Figure 9 : Impulse response of inflation expectations curve to a +1%pt realized inflation
shock
Finally, based on the estimates of the synthesized inflation expectations indicator and inflation expectations curve, we review developments in underlying inflation expectations since the launch of Quantitative and Qualitative Monetary Easing (QQE) in 2013 (Figure 10). At first, inflation expectations increased after QQE began. Then, reflecting the drop in oil prices and other factors, inflation expectations stayed largely unchanged after the summer of 2014, and weakened in the summer of 2015. Subsequently, between 2018 and 2020 before the COVID-19 outbreak, they had been more or less unchanged. Although inflation expectations weakened somewhat after the spring of 2020, due to the spread of COVID-19, they have been more or less unchanged in recent months.
Figure 10 : Time-series of the indicators of inflation expectations extracted from various data series
- 7For example, FRB economists, Ahn and Fulton (2020), have developed an indicator of underlying inflation expectations called "Index of Common Inflation Expectations."
Conclusion
In this article, we have reviewed the characteristics of various indicators of inflation expectations based on recent academic research. We have also reported recent developments in inflation expectations, focusing on the period since the spread of COVID-19. Judging from overall movements in various indicators, inflation expectations in Japan weakened somewhat after the outbreak of COVID-19 in early 2020, but they have been more or less unchanged in recent months.
However, given the great uncertainty over the consequences of COVID-19 and their impact on domestic and overseas economies, future developments in inflation expectations will also continue to be highly uncertain. It is therefore important to continue monitoring developments in the various indicators of inflation expectations by considering their characteristics.
Reference
- Ahn, H. J. and Fulton, C. (2020) "Index of Common Inflation Expectations, (Link to an external website)" FEDS Notes, Board of Governors of the Federal Reserve System.
- Andreasen, M. M., Christensen, J. H. E., and Riddell, S. (2020) " The TIPS Liquidity Premium [PDF] (Link to an external website)," Federal Reserve Bank of San Francisco Working Paper Series, 2017-11, Federal Reserve Bank of San Francisco.
- Bank of Japan (2021) "Assessment for Further Effective and Sustainable Monetary Easing [PDF 4,374KB]," March 2021.
- Bernanke, B. S. (2004) " What Policymakers Can Learn from Asset Prices [PDF] (Link to an external website)," speech before The Investment Analysts Society of Chicago, Federal Reserve Board.
- Bernanke, B. S. (2007) "Inflation Expectations and Inflation Forecasting (Link to an external website), " speech at the Monetary Economics Workshop of the National Bureau of Economic Research Summer Institute, Cambridge, Massachusetts.
- Candia, B., Coibion, O., and Gorodnichenko, Y. (2020) " Communication and the Beliefs of Economic Agents [PDF] (Link to an external website)," paper prepared for the Jackson Hole Economic Policy Symposium.
- Candia, B., Coibion, O., and Gorodnichenko, Y. (2021) "The Inflation Expectations of U.S. Firms: Evidence from a New Survey," NBER Working Paper, No. 28836.
- Carroll, C. D. (2003) "Macroeconomic Expectations of Households and Professional Forecasters," Quarterly Journal of Economics, 118(1), pp.269-298.
- Coibion, O., Gorodnichenko, Y., Kumar, S., and Pedemonte, M. (2020) "Inflation Expectations as a Policy Tool? (Link to an external website)" Journal of International Economics, 124, 103297.
- Crump, R. K., Eusepi, S., and Moench, E. (2018) "The Term Structure of Expectations and Bond Yields, (Link to an external website)" Staff Reports, No.775, Federal Reserve Bank of New York.
- Diamond, J., Watanabe, K., and Watanabe, T. (2020) "The Formation of Consumer Inflation Expectations: New Evidence from Japan's Deflation Experience," International Economic Review, 61(1), pp.241-281.
- Hiraki, K. and Hirata, W. (2020) "Market-based Long-term Inflation Expectations in Japan: A Refinement on Breakeven Inflation Rates [PDF 2,492KB], " Bank of Japan Working Paper Series, No. 20-E-5.
- Inatsugu, H., Kitamura, T., and Matsuda, T. (2019) "The Formation of Firms' Inflation Expectations: A Survey Data Analysis [PDF 310KB], " Bank of Japan Working Paper Series, No. 19-E-15.
- Maruyama, T. and Suganuma, K. (2019) "Inflation Expectations Curve in Japan [PDF 833KB], " Bank of Japan Working Paper Series, No. 19-E-6.
- Nishiguchi, S., Nakajima, J., and Imakubo, K. (2014) "Disagreement in Households' Inflation Expectations and its Evolution [PDF 390KB], " Bank of Japan Review Series, 2014-E-1.
- Nishino, K., Yamamoto, H., Kitahara, J., and Nagahata, T. (2016) "Developments in Inflation Expectations over the Three Years since the Introduction of Quantitative and Qualitative Monetary Easing (QQE) [PDF 414KB], " Bank of Japan Review Series, 2016-E-13.
- Sekine, T., Yoshimura, K., and Wada, C. (2008) "On Inflation Expectations [PDF 365KB], " Bank of Japan Review Series, 2008-J-15 (in Japanese).
- Uno, Y., Naganuma, S., and Hara, N. (2018) "New Facts about Firms' Inflation Expectations: Simple Tests for a Sticky Information Model [PDF 206KB], " Bank of Japan Working Paper Series, No. 18-E-14.
- Yellen, J. (2015) "Transcript of Chair Yellen's FOMC Press Conference: March 18, 2015 [PDF] (Link to an external website)," Board of Governors of the Federal Reserve System.
Notice
The views expressed herein are those of the authors and do not necessarily reflect those of the Bank of Japan.

