Using Text Analysis to Gauge the Reasons for Respondents' Assessment in the Economy Watchers Survey
MIKAMI Tomoaki, YAMAGATA Hiroaki, NAKAJIMA Jouchi
Research LAB No.21-E-2, December 20, 2021
Keywords: Big data; Text analysis; Economy Watchers Survey; Co-occurrence network diagram
Contact: jouchi.nakajima@boj.or.jp (NAKAJIMA Jouchi)
Summary
The Economy Watchers Survey released monthly by the Cabinet Office provides not only the headline diffusion index of the economic assessment of survey respondents (so-called "economy watchers") but also textual data from respondents' comments giving reasons for their assessment. Employing such data, this article presents an example of the use of text analysis, which has attracted increasing attention in recent years. Following Tsuruga and Okazaki (2017) and Otaka and Kan (2018), we construct co-occurrence network diagrams to explore what issues economy watchers focus on. The co-occurrence network diagrams drawn using data for mid-2021 show that economy watchers mainly focused on the State of Emergency and business restrictions related to COVID-19, developments in the vaccination process, and the shortage of semiconductors for automobile production. Our analysis shows that textual data are useful for an assessment of the economy; it is important to make efforts to improve text analysis methods.
1. Introduction
Recent years have seen a proliferation in the use of novel data for the assessment of economic activity and prices. Examples are the use of granular and high-frequency data such as credit card transaction data, location information data obtained from smartphones, and information other than numerical data. Such novel data are called "alternative data" since their characteristics differ from conventional statistics, or "big data," since the amount of information is enormous. Most types of big data are not necessarily collected for the purpose of economic analysis, and it therefore sometimes presents a challenge to interpret them. However, they potentially contain information useful for assessing developments in economic activity and prices in a more timely manner or from a different angle than conventional statistics. Consequently, interest in developing methods for analyzing such data has increased considerably.
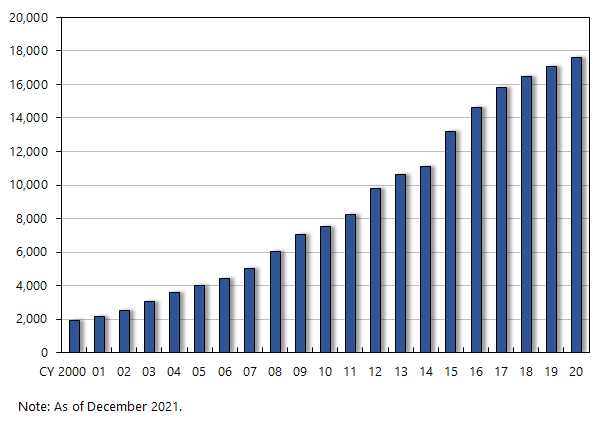
One type of such big data analysis that has attracted increasing attention in recent years is text analysis. Text analysis focuses on the statistical analysis of words instead of conventional numerical data. While text analysis has a long history, research into text analysis has made substantial progress in recent years due to the increased ease of collecting and analyzing text data as a result of advances in information technology (see Figure 1).
Figure 1 . Number of academic papers on Google Scholar including the term "text analysis"
This article provides an example of text analysis using the Economy Watchers Survey (EWS). The EWS has been conducted monthly by the Cabinet Office since January 2000. The survey aims to grasp developments in Japan's economy in a timely manner. Survey respondents consist of "economy watchers," that is, individuals holding jobs that enable them to closely watch developments in economic activity, such as business managers and grocery clerks. These economy watchers are asked to provide their assessment of current economic conditions and their forecast for the coming months on a scale comprising five categories ranging from, e.g., "better" to "worse."
The EWS asks respondents representing all the major regions across Japan, from Hokkaido to Okinawa. The composition of respondents by industry indicates that those engaged in household activity-related sectors account for about two thirds of respondents, which means that many of the survey respondents are engaged in industries that have a relatively close link with consumers.
The EWS is conducted around the last week of each month, and the result is released early in the following month. The diffusion indexes (DIs) for current and forecasted economic conditions can be regarded as timely and useful indicators for assessing economic activity as they show some correlation with other macroeconomic indicators that capture economic developments.
The EWS is unique in that it collects not only respondents' assessment of economic conditions on a scale as just described but also their comments giving reasons for their assessment.1 Examples of such comments are provided in Table 1. As pointed out by Otaka and Kan (2018), while textual data from newspaper articles and social network posts generally contain a considerable amount of noise which needs to be eliminated when using such sources to analyze people's economic assessments, the textual data from the EWS contain less noise because almost all the comments are related to developments in economic activity and prices. In addition, the dataset is published in a form in which differences in wording among respondents have been corrected for, meaning that researchers do not need to make such corrections normally required for text analysis. For these reasons, the textual data from the EWS are suitable for text analysis. The dataset from each survey consists of about 100,000 words in total and can therefore be regarded as big data.
| Assessment of the economic conditions | Sector (Occupation) | Comments |
|---|---|---|
| Slightly better | Supermarket (Store manager) | While average sales per customer remain below last year's level, the number of customers has been picking up. |
| Unchanged | Job placement office (Staff) | Despite a downward trend in job openings compared with the previous year, business managers seem to struggle to fill vacancies and that there remains a sense of labor shortage in the nursing-case and construction sectors. |
In the following sections, we first illustrate the usefulness of the data using a simple analytical approach. Next, following Tsuruga and Okazaki (2017) and Otaka and Kan (2018), who apply various text analysis methods to the EWS textual data to assess developments in economic activity and prices, we construct a "co-occurrence network diagram" using recent data from the EWS to examine what issues economy watchers have been focusing on when assessing economic conditions during the current COVID-19 pandemic.2
- Note that the comments we mention here are in Japanese.
- See also Goshima et al. (2021) and Nakajima et al. (2021) for analyses of the textual data from the EWS.
2. Assessment of issues that economy watchers focus on based on frequency of word appearance
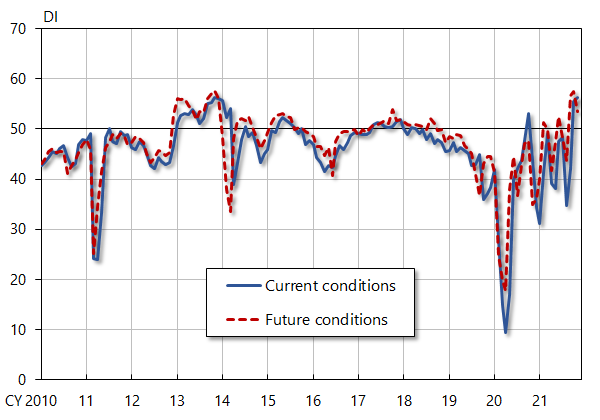
We start by looking at the EWS headline DIs for current and future economic conditions, which are plotted in Figure 2. The DIs fell substantially in early 2020 as a result of the outbreak of the COVID-19 pandemic and since then have been extremely volatile, indicating that the confidence of EWS respondents has fluctuated wildly, reflecting the various twists and turns in the COVID-19 situation.
Figure 2 . Economy Watchers Survey: DIs for current and future economic conditions
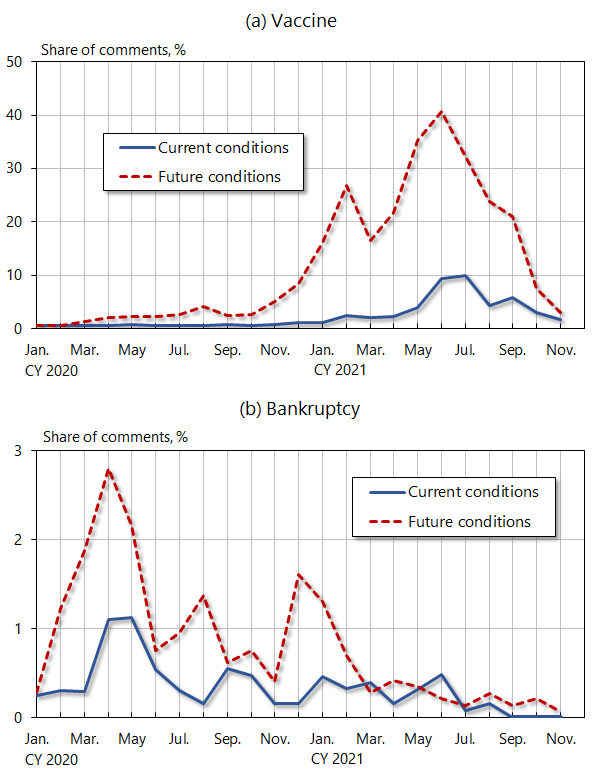
One basic approach to analyzing such data is to simply count the frequency with which specific words appear in texts. For example, use of the word "vaccine" is likely to be closely associated with the idea that the pandemic will be contained. Figure 3(a) plots the frequency with which the word "vaccine" has appeared in the comments on current and future economic conditions. In early 2021, there was a notable increase in the frequency of the word in comments on future economic conditions. In June 2021, the frequency of mentions also increased in comments on current economic conditions. This suggests that there was a gradual increase in expectations regarding vaccination efforts, and that actual progress in vaccinations has gradually affected the current state of the economy.
Figure 3(b) plots the frequency of the appearance of the word "bankruptcy," which increased markedly at the early stage of the pandemic in 2020 but then decreased and has remained at a low level. This suggests that the growing concerns about firms' cash flow at the start of the pandemic were dispelled due to cash flow support measures by the government and the Bank of Japan.
Figure 3 . Economy Watchers Survey: Share of comments including the term
3. Co-occurrence network diagram: Using network diagrams to understand the link between words
The previous section suggested that looking at the frequency of specific words in textual data can help to explore the reasons for developments in business confidence. However, this simple analysis has limitations. For example, the selection of words whose frequency is measured may be arbitrary, and the meaning of the same word may differ depending on the situation. For example, the word "vaccine" may have completely opposite connotations, depending on the context, such as whether it appears in a phrase such as "slow pace of vaccination" or, alternatively, "vaccination is making good progress."
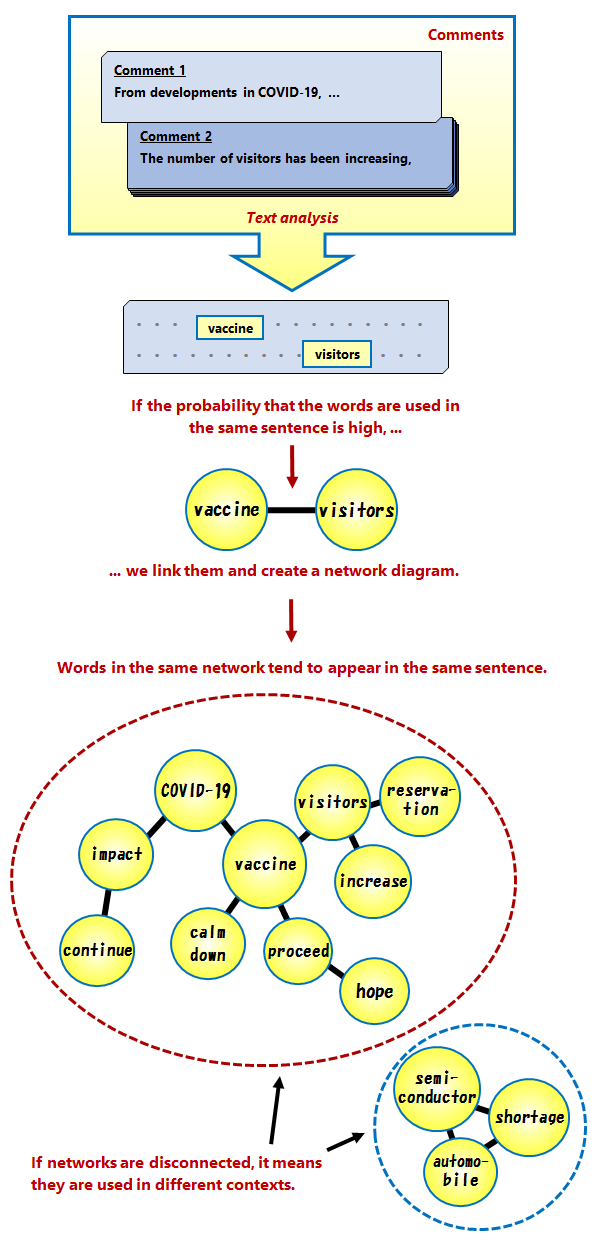
To overcome this issue, Tsuruga and Okazaki (2017) and Otaka and Kan (2018) propose using a "co-occurrence network diagram" for the analysis of textual data. The word "co-occurrence" means that two words are used in the same context. For example, if the words "vaccine" and "visitors" are used frequently in the same comment, the co-occurrence relationship between "vaccine" and "visitors" is said to be strong. Constructing a co-occurrence network diagram helps to visualize the relationships between various words and grasp the context in which words are used and the issues that economy watchers focus on when assessing economic conditions (see Figure 4).
Figure 4 . Illustration of co-occurrence network diagram
We draw the co-occurrence network diagram based on the following three steps.
Step 1: Extract important words from the comments
We extract important words that are mentioned frequently. One way to measure the importance of words is to use the Dice coefficient, which measures the number of times a word appears in the current month compared to the same month in previous years. The reason why the frequency of appearances is measured in comparison with the same month in previous years is that there is a seasonality in the appearance of some of the words used in the comments.3 For example, the word "Christmas" for obvious reasons appears more frequently in December than in summer. To examine if the word "Christmas" is of particular importance this December, we need to see if it appears more frequently than in previous Decembers. For our analysis, we extract the 100 most important words each month based on the Dice coefficient.
Step 2. Measure the co-occurrence relationship between important words
We measure the co-occurrence relationship between the 100 most important words using comments containing at least one of those words. To measure co-occurrence, we use the Jaccard index. The Jaccard index for words X and Y is defined as the value obtained by dividing the frequency with which X and Y are used in the same comment by the frequency with which X or Y are used. Thus, the more frequently two words are used in the same comment (i.e., the stronger the co-occurrence relationship is), the larger is the Jaccard index.4
Step 3: Draw the network diagram
Finally, we pick the words with a high co-occurrence relationship, i.e., whose Jaccard index exceeds a certain threshold, and draw the network diagram.5
- 3See Otaka and Kan (2018) for details.
- 4If a comment consists of two sentences, we treat the sentences as two comments when calculating the Jaccard index.
- 5In this article, we use the software package "KH Coder" to draw the co-occurrence network diagrams.
4. Assessment of issues that economy watchers focus on based on co-occurrence network diagrams
This section provides examples of the construction of co-occurrence network diagrams using the EWS textual data.
Figure 5 plots the diagram based on the comments for the current conditions DI in June 2021. Note that the words are the authors' translation from the Japanese original. The size of the circles in which words are written indicates the frequency of appearance in terms of the Dice coefficient. That is, the more frequently a word is mentioned, the larger the circle. The thickness of the lines connecting the circles represents the strength of the co-occurrence relationship. The thicker a line, the higher the Jaccard coefficient, i.e., the more often the two words are used in the same context.6
Looking at the size of the circles for individual words, words such as "COVID-19," "state," "emergency," and "declaration" stand out, and the word "visitors" is also frequently mentioned.7
Figure 5 . Co-occurrence network diagram for comments for the current conditions DI in June 2021
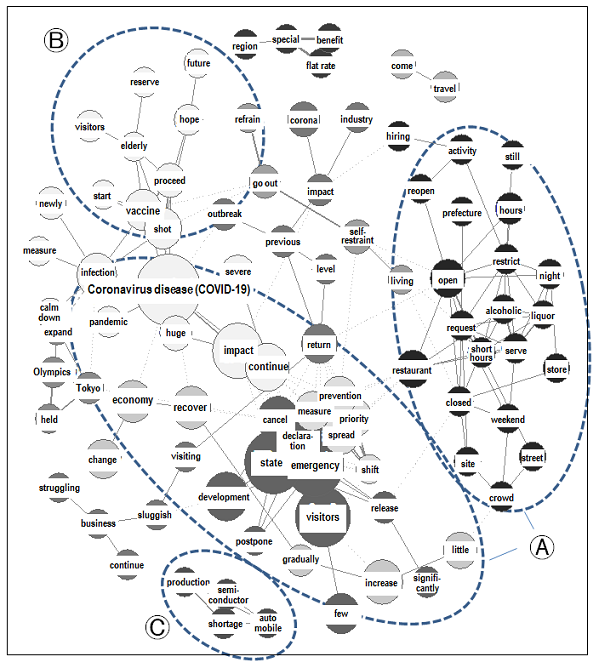
Looking at the co-occurrence relationship between words, in word group A, "state," "emergency," "declaration," "spread," "prevention," "priority," and "measure" are linked to "COVID-19." These words are strongly linked to the large circle for "visitors," and the word "visitors" is further linked to the word "few." In addition, these words are also linked to the words "request," "restaurants," "short hours," "restrict," "serve," "alcoholic," and "liquor." From these words, we can surmise that the re-strengthening of public health measures due to the spread of COVID-19 led to a decrease in the number of visitors to restaurants and other venues, which affected respondents' assessment of the current state of the economy. Word group B contains the words "vaccine" and "shot," which are linked with the words "future" and "hope," suggesting that expectations of progress in vaccinations had some impact on assessments of the current state of the economy. Finally, word group C comprises words such as "automobile," "semiconductor," and "shortage." We can surmise that the economy watchers focused on semiconductor shortages and saw these as a production constraint, especially in the automobile industry.
Figure 6 . Co-occurrence network diagram for comments for the future conditions DI in June 2021
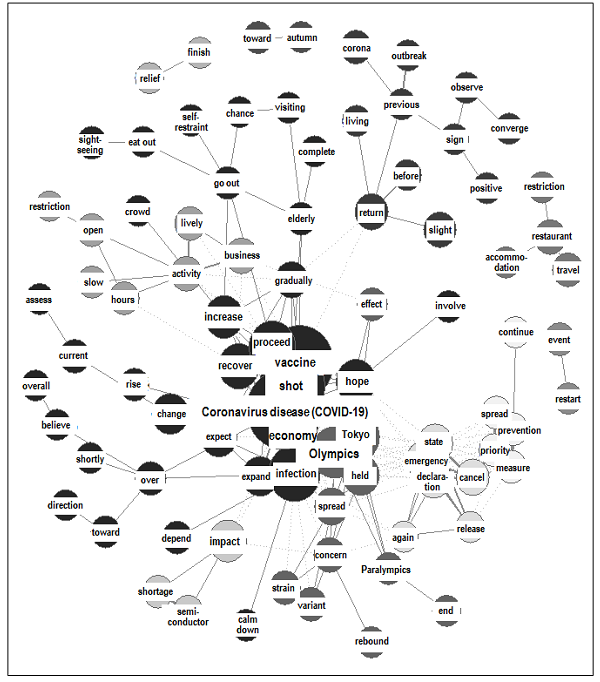
Figure 6 plots the co-occurrence network diagram created from comments for the future conditions DI in June 2021. The circles for words such as "COVID-19," "vaccine," "shot," "Tokyo," "Olympics," and "infection" are relatively large, and the co-occurrence links between these words are quite strong. One notable point is that these words are linked to both cautious words such as "concern" and positive words such as "hope" and "recover." This suggests that respondents had mixed views on the impact and implications of the pandemic for economic prospects.
The examples presented here show that we can assess developments in economic activity and prices using not only the DIs of current and future conditions but also respondents' comments, which provide us with an understanding of the underlying reasons for developments in the DIs.
- 6Meanwhile, the shading of circles identifies words that are connected by a solid line. The degree of shading has no significance.
- 7In the Japanese original, the word "visitors" here has the nuance of customers visiting venues such as shops and restaurants.
5. Concluding remarks
This article explained how, using textual data from economy watchers' comments in the EWS, co-occurrence network diagrams can be used to provide a visual understanding of the reasons underlying respondents' assessment of economic activity and prices. The examples using data from June 2021 indicated which issues economy watchers focused on when judging developments in economic activity and prices against the background of the COVID-19 pandemic.
Our analysis showed that text analysis is useful for grasping developments in economic activity and prices. In order to judge complex developments in the economic and price situation in an accurate and timely manner, text analysis and the use of big data provide useful tools, and further refining such tools is highly desirable.
References
- Goshima, K., Ishijima, H., Shintani, M., and Yamamoto H. (2021). "Forecasting Japanese inflation with a news-based leading indicator of economic activities,"(Link to an external website) Studies in Nonlinear Dynamics & Econometrics, 25(4), pp. 111-113.
- Nakajima, J., Yamagata, H., Okuda, T., Katsuki, S., and Shinohara, T. (2021). "Extracting firms' short-term inflation expectations from the Economy Watchers Survey using text analysis,"[PDF 392KB] Bank of Japan Working Paper Series, No. 21-E-12.
- Otaka, K., and Kan, K. (2018). "Economic analysis using machine learning: Text mining of the 'Economy Watchers Survey'," Bank of Japan Working Paper Series, No. 18-J-8 (in Japanese) .
- Tsuruga, T., and Okazaki, Y. (2017). "Financial and economic analysis using text data: An analysis using the surveys and results of the Economy Watchers Survey," Toukei, April 2017 (in Japanese) .
Notice
The views expressed herein are those of the authors and do not necessarily reflect those of the Bank of Japan.